

Question: Based on the following data please do the following 1. Populate the Table (7 Marks) 2. Plot the Divisions on IE Matrix (10 Marks) 3.
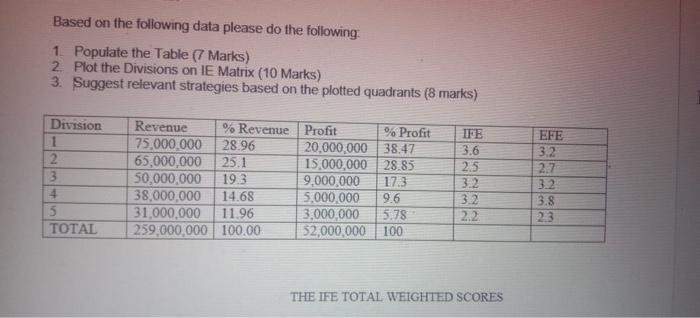
Based on the following data please do the following 1. Populate the Table (7 Marks) 2. Plot the Divisions on IE Matrix (10 Marks) 3. Suggest relevant strategies based on the plotted quadrants (8 marks) Division 1 2 3 4 5 TOTAL Revenue % Revenue Profit % Profit 75,000,000 28.96 20,000,000 38.47 65,000,000 25.1 15.000.000 28.85 50,000,000 19.3 9,000,000 17.3 38,000,000 14.68 5,000,000 9.6 31,000,000 11.96 3,000,000 5.78 259.000.000 100.00 52,00 100 TRE 3.6 2.5 3.2 3.2 EFE 3.2 27 3.2 3.8 23 2.2 THE IFE TOTAL WEIGHTED SCORES
Step by Step Solution
There are 3 Steps involved in it
1 Expert Approved Answer
Step: 1 Unlock

Question Has Been Solved by an Expert!
Get step-by-step solutions from verified subject matter experts
Step: 2 Unlock
Step: 3 Unlock