

Question: Based on the following tables from a economic simulation, answer the following: Share your experience in the simulation. In your opinion, which policy decisions were
Based on the following tables from a economic simulation, answer the following:
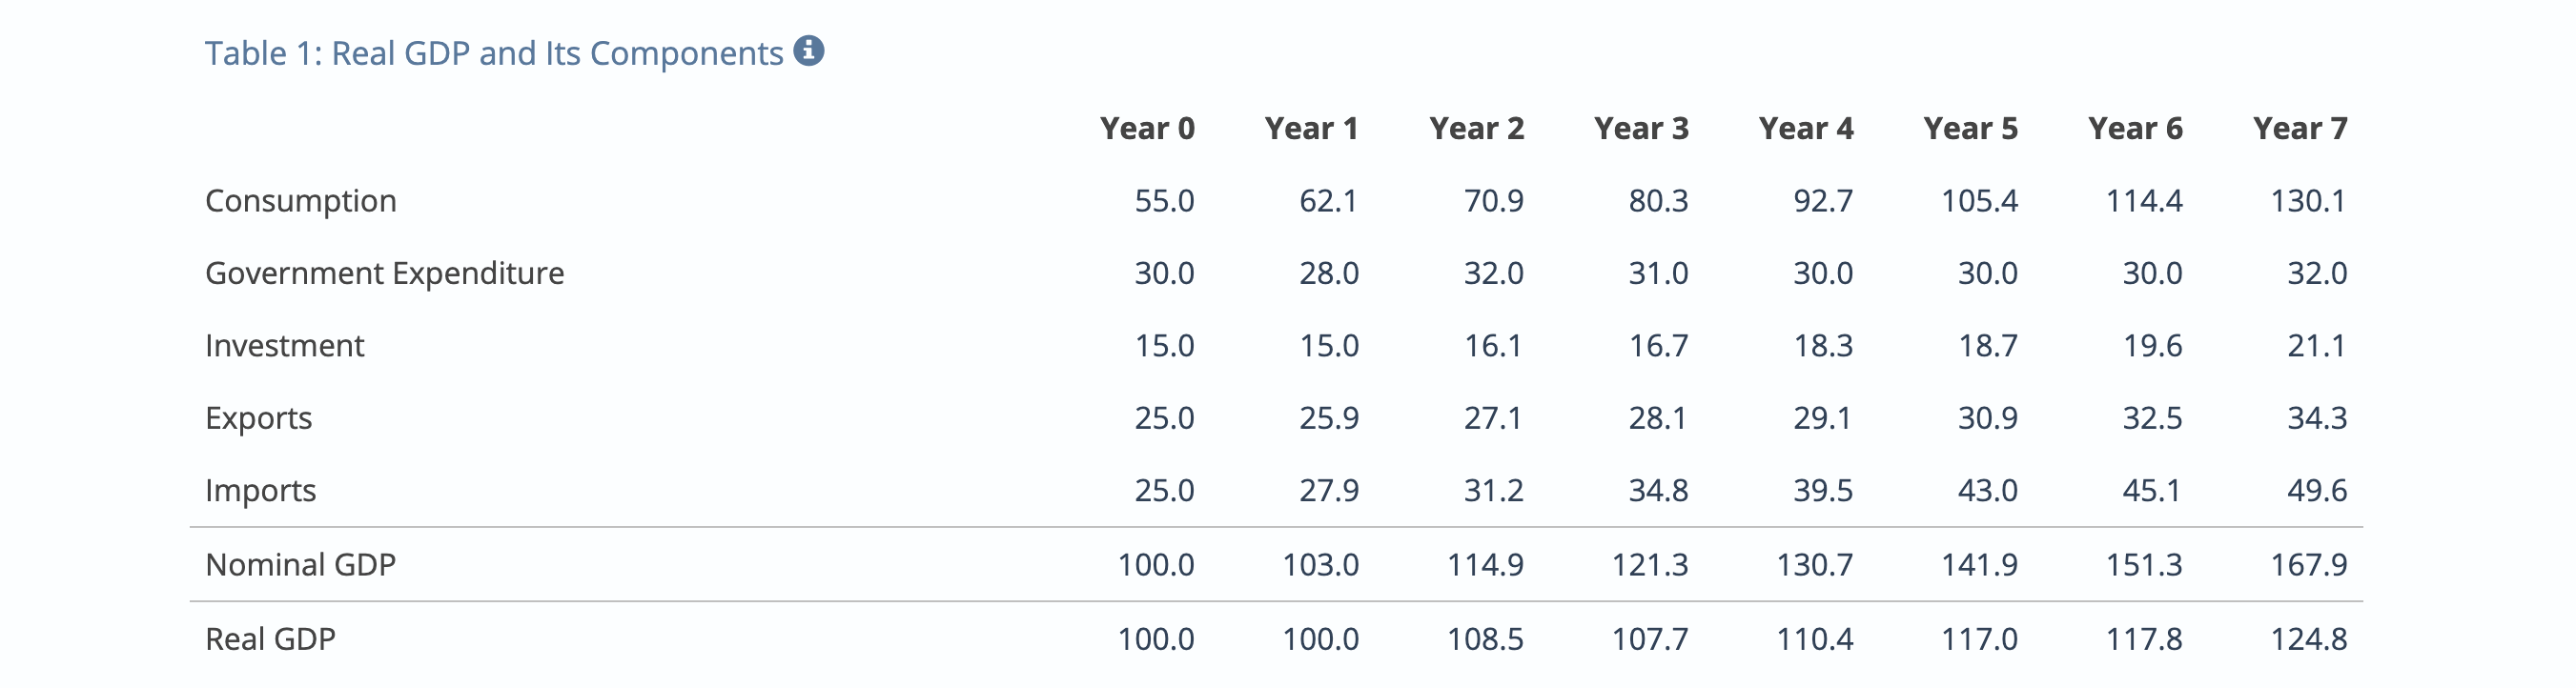
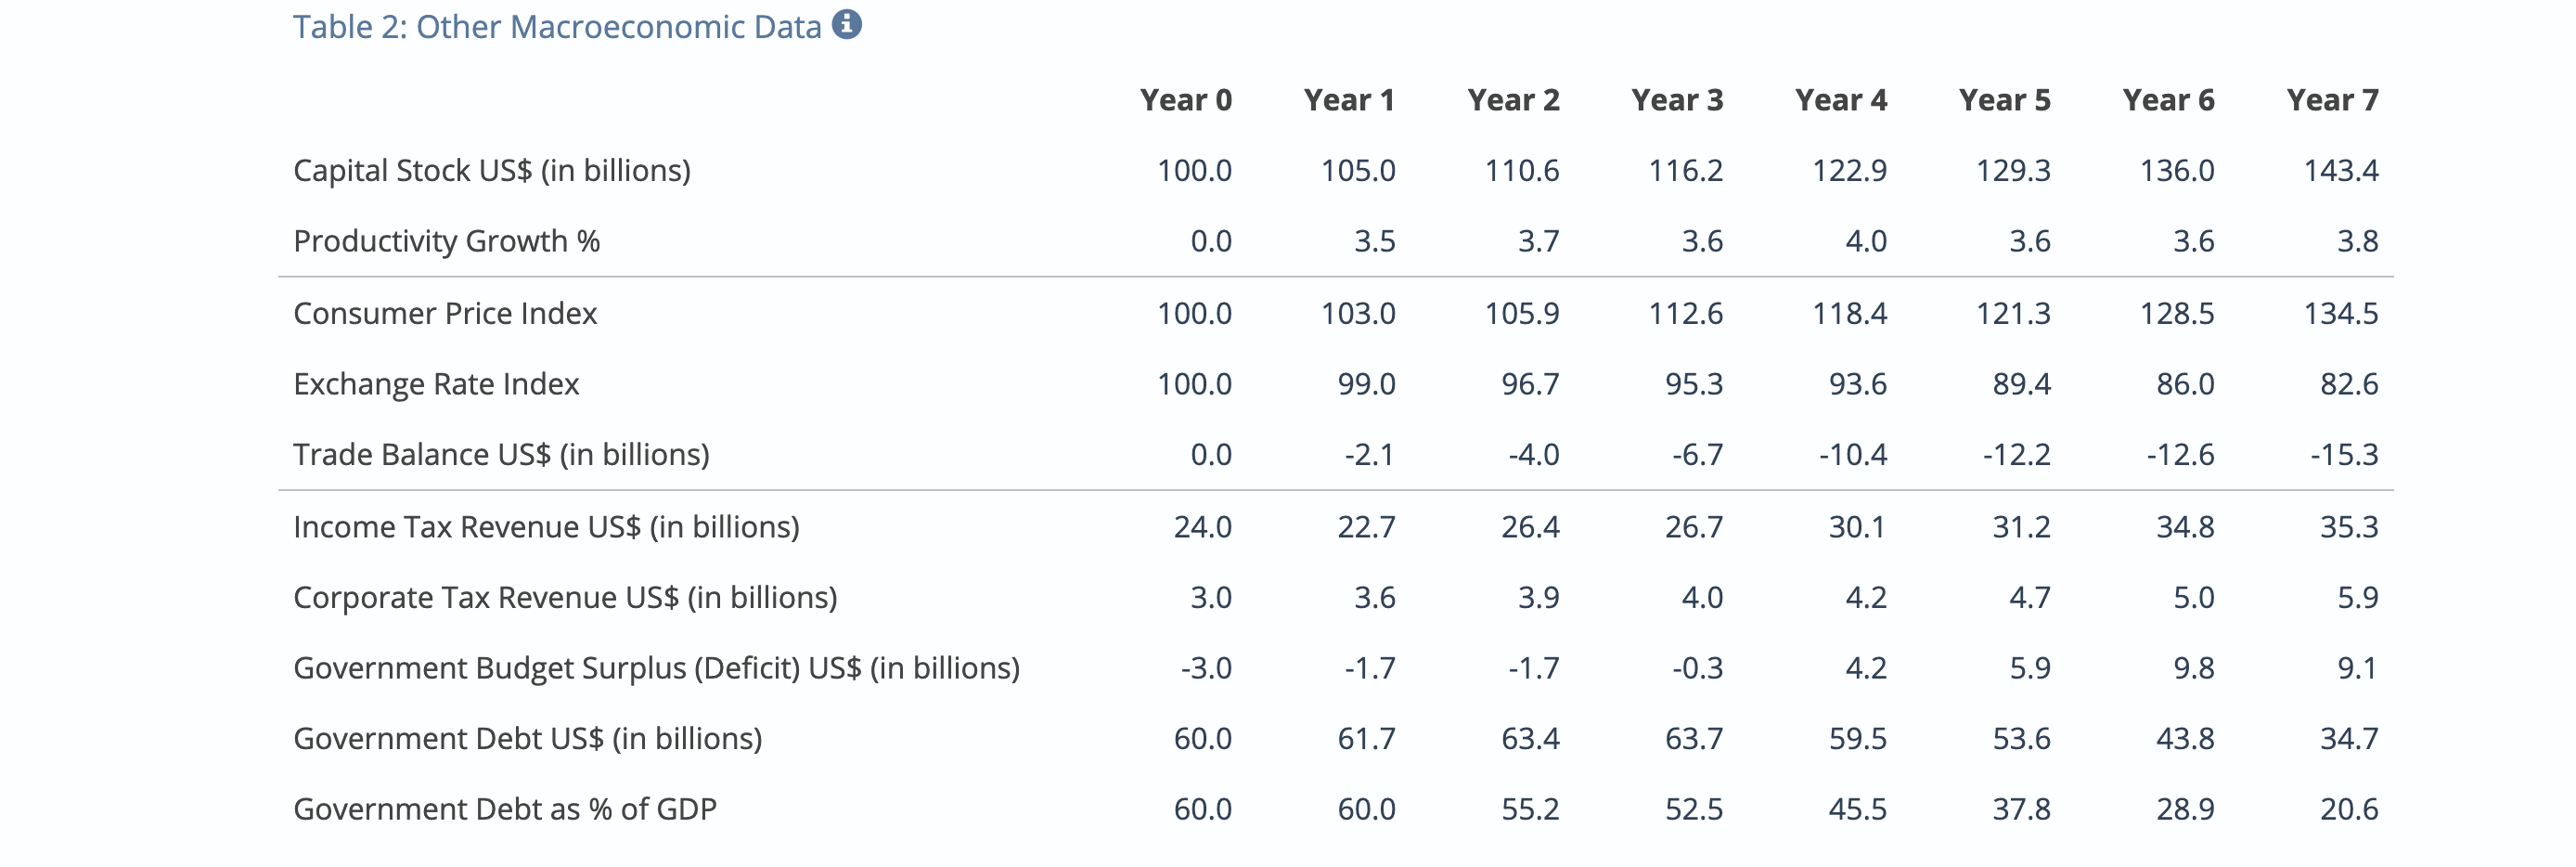
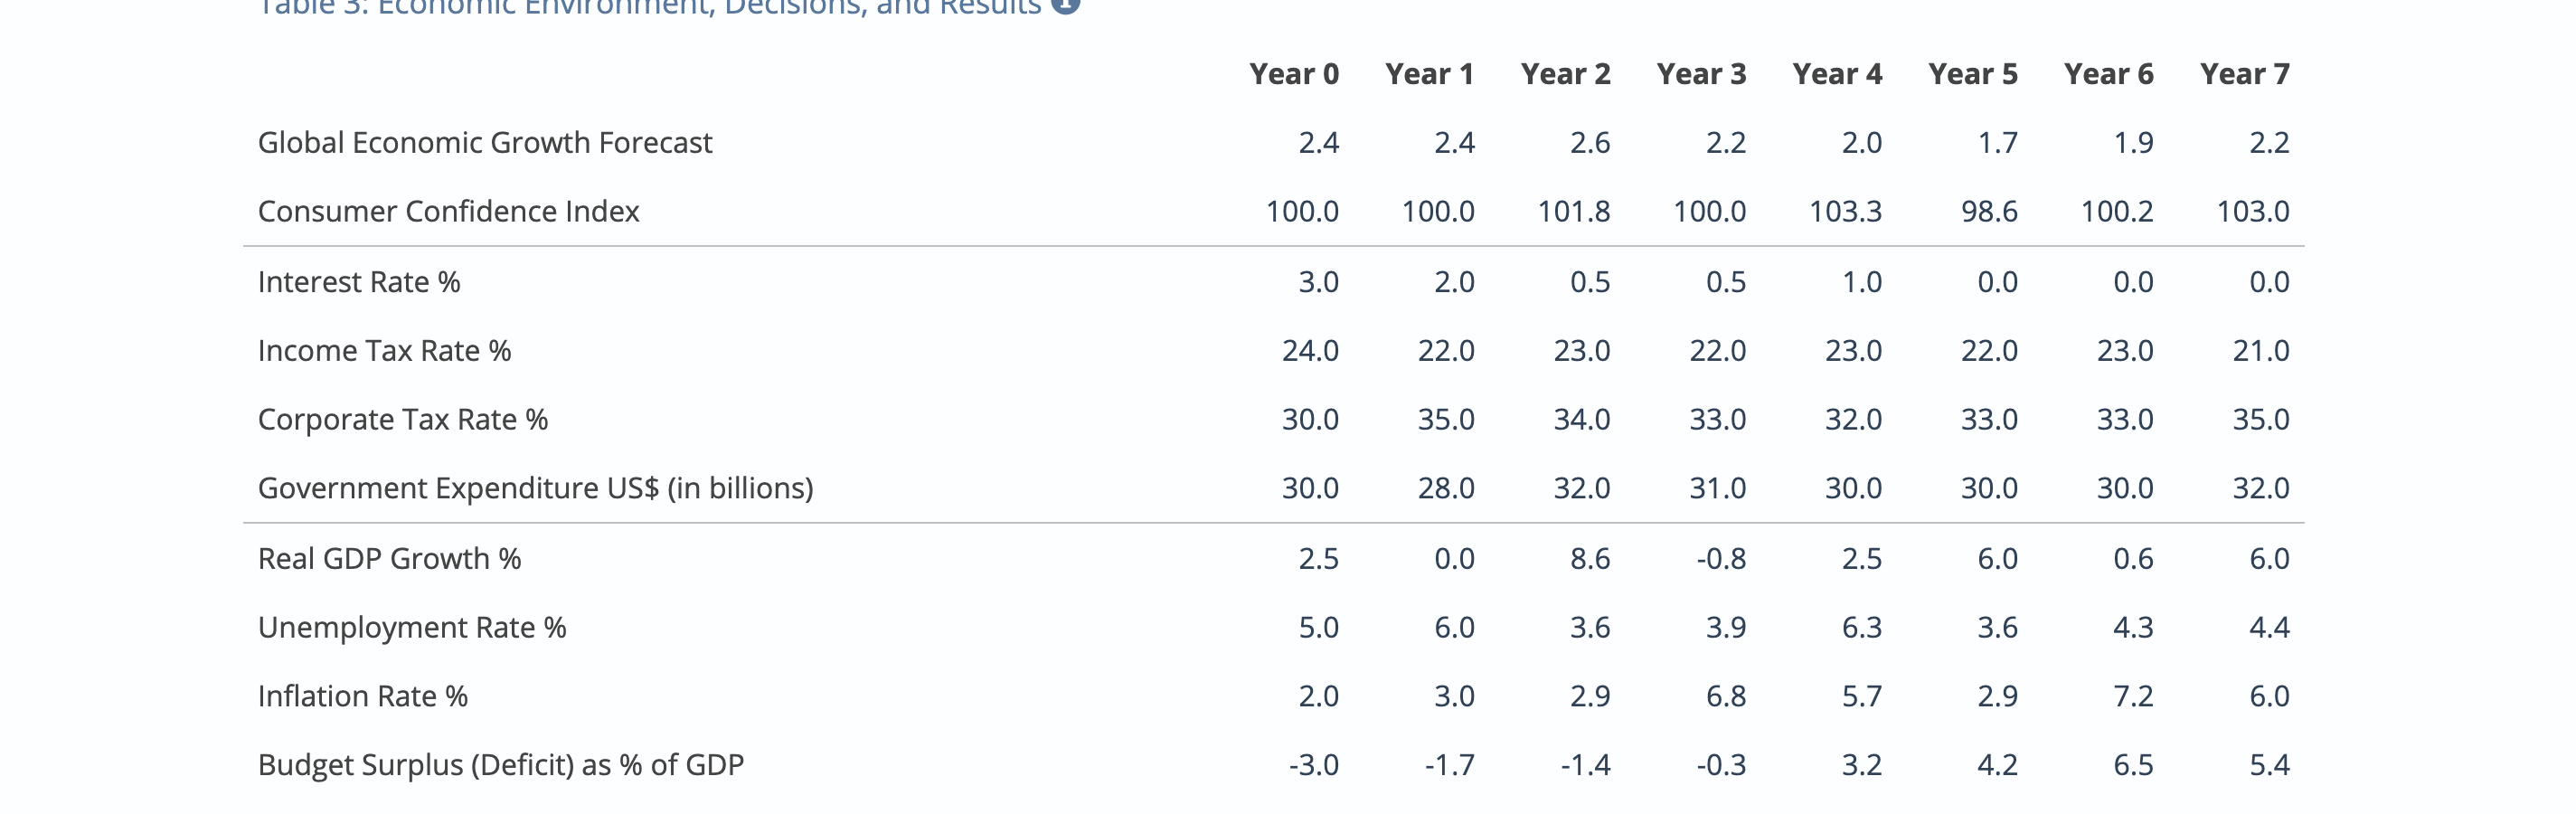
Share your experience in the simulation. In your opinion, which policy decisions were more successful and why? Why does the simulation provide you with a global economic outlook for each year? How does an open economy versus a closed economy impact government policy decisions? Use information from news to support your answer. At the end of each year, the simulation highlights changes in consumer confidence. Why is the economic indicator consumer sentiment" relevant for making successful policy decisions? Use news sources to support your the answer. Table 1: Real GDP and Its Components Year 0 Year 1 Year 2 Year 3 Year 4 Year 5 Year 6 Year 7 Consumption 55.0 62.1 70.9 80.3 92.7 105.4 114.4 130.1 Government Expenditure 30.0 28.0 32.0 31.0 30.0 30.0 30.0 32.0 Investment 15.0 15.0 16.1 16.7 18.3 18.7 19.6 21.1 Exports 25.0 25.9 27.1 28.1 29.1 30.9 32.5 34.3 Imports 25.0 27.9 31.2 34.8 39.5 43.0 45.1 49.6 Nominal GDP 100.0 103.0 114.9 121.3 130.7 141.9 151.3 167.9 Real GDP 100.0 100.0 108.5 107.7 110.4 117.0 117.8 124.8 Table 2: Other Macroeconomic Data i Year 0 Year 1 Year 2 Year 3 Year 4 Year 5 Year 6 Year 7 Capital Stock US$ (in billions) 100.0 105.0 110.6 116.2 122.9 129.3 136.0 143.4 Productivity Growth % 0.0 3.5 3.7 3.6 4.0 3.6 3.6 3.8 Consumer Price Index 100.0 103.0 105.9 112.6 118.4 121.3 128.5 134.5 Exchange Rate Index 100.0 99.0 96.7 95.3 93.6 89.4 86.0 82.6 Trade Balance US$ (in billions) 0.0 -2.1 -4.0 -6.7 -10.4 -12.2 -12.6 -15.3 Income Tax Revenue US$ (in billions) 24.0 22.7 26.4 26.7 30.1 31.2 34.8 35.3 Corporate Tax Revenue US$ (in billions) 3.0 3.6 3.9 4.0 4.2 4.7 5.0 5.9 Government Budget Surplus (Deficit) US$ (in billions) -3.0 -1.7 -1.7 -0.3 4.2 5.9 9.8 9.1 Government Debt US$ (in billions) 60.0 61.7 63.4 63.7 59.5 53.6 43.8 34.7 Government Debt as % of GDP 60.0 60.0 55.2 52.5 45.5 37.8 28.9 20.6 I dole 5. environs ons, Year 0 Year 1 Year 2 Year 3 Year 4 Year 5 Year 6 Year 7 Global Economic Growth Forecast 2.4 2.4. 2.6 2.2 2.0 1.7 1.9 2.2 Consumer Confidence Index 100.0 100.0 101.8 100.0 103.3 98.6 100.2 103.0 Interest Rate % 3.0 2.0 0.5 0.5 1.0 0.0 0.0 0.0 Income Tax Rate % 24.0 22.0 23.0 22.0 23.0 22.0 23.0 21.0 Corporate Tax Rate % 30.0 35.0 34.0 33.0 32.0 33.0 33.0 35.0 Government Expenditure US$ (in billions) 30.0 28.0 32.0 31.0 30.0 30.0 30.0 32.0 Real GDP Growth % 2.5 0.0 8.6 -0.8 2.5 6.0 0.6 6.0 Unemployment Rate % 5.0 6.0 3.6 3.9 6.3 3.6 4.3 4.4 Inflation Rate % 2.0 3.0 2.9 6.8 5.7 2.9 7.2 6.0 Budget Surplus (Deficit) as % of GDP -3.0 -1.7 -1.4 -0.3 3.2 4.2 6.5 5.4
Step by Step Solution
There are 3 Steps involved in it

Get step-by-step solutions from verified subject matter experts