

Question: Based on the frequency table you provided earlier, here are the values for each slice of the pie chart: * Slice 1(6 0z): 3 individuals
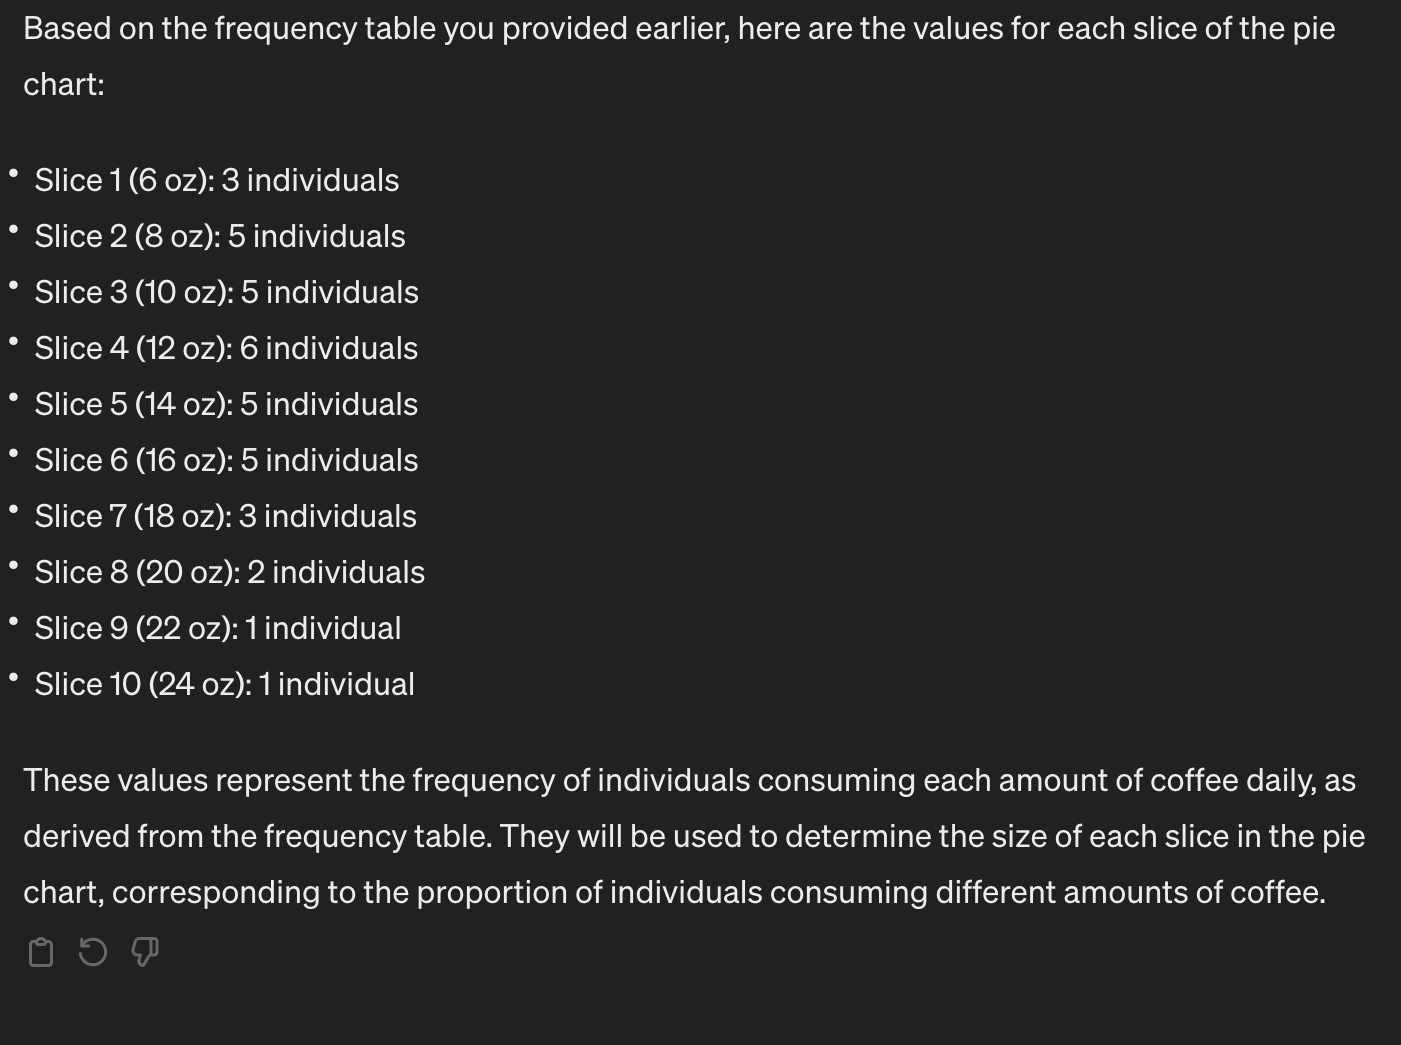
Based on the frequency table you provided earlier, here are the values for each slice of the pie chart: * Slice 1(6 0z): 3 individuals * Slice 2 (8 0z): 5 individuals * Slice 3 (10 02): 5 individuals * Slice 4 (12 0z): 6 individuals * Slice 5 (14 0z2): 5 individuals * Slice 6 (16 0z): 5 individuals * Slice 7 (18 02): 3 individuals * Slice 8 (20 0z): 2 individuals * Slice 9 (22 0z): 1individual * Slice 10 (24 0z): 1 individual These values represent the frequency of individuals consuming each amount of coffee daily, as derived from the frequency table. They will be used to determine the size of each slice in the pie chart, corresponding to the proportion of individuals consuming different amounts of coffee
Step by Step Solution
There are 3 Steps involved in it

Get step-by-step solutions from verified subject matter experts