

Question: Based on the graph below. Monthly data on sales for your product over the past 12 months is shown below. a) Discuss linear trend model
Based on the graph below. Monthly data on sales for your product over the past 12 months is shown below.
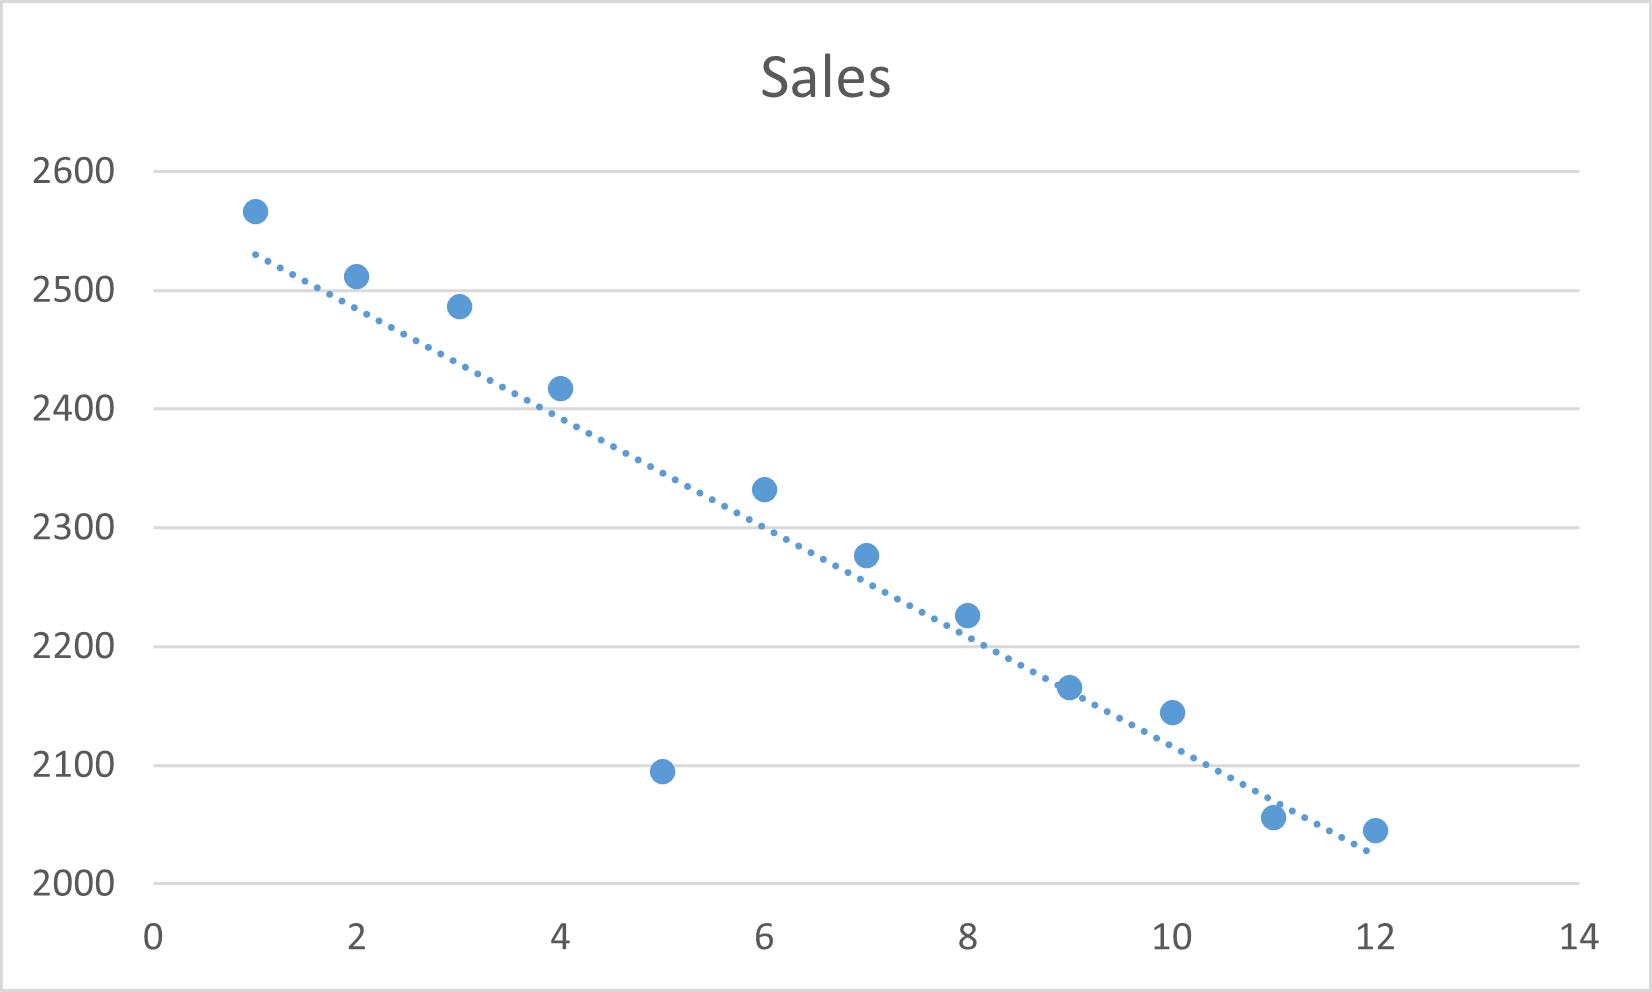
a) Discuss linear trend model fit to the data.
b) What outcome would you expect if you used a simple moving average to forecast sales for the product pictured above?
Sales 2600 2500 2400 2300 2200 2100 2000 2 4 8 10 12 14
Step by Step Solution
★★★★★
3.46 Rating (159 Votes )
There are 3 Steps involved in it
1 Expert Approved Answer
Step: 1 Unlock

a The straight line has a negative slope Number of sales decreases with months bA moving average ... View full answer
Question Has Been Solved by an Expert!
Get step-by-step solutions from verified subject matter experts
Step: 2 Unlock
Step: 3 Unlock