

Question: Based on the graph below, where can General Mills make improvements? General Mills (2019) % Difference Current Ratio (L) Quick Ratio (L) ROA (P) ROE
Based on the graph below, where can General Mills make improvements?
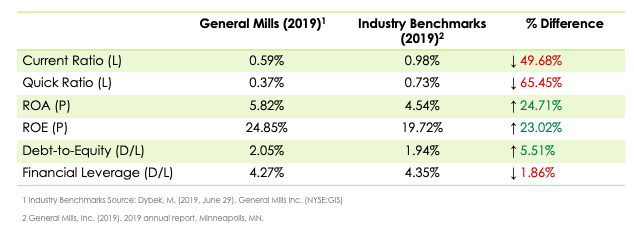
General Mills (2019) % Difference Current Ratio (L) Quick Ratio (L) ROA (P) ROE (P) Debt-to-Equity (D/L) Financial Leverage (D/L) 0.59% 0.37% 5.82% 24.85% 2.05% 4.27% Industry Benchmarks (2019) 0.98% 0.73% 4.54% 19.72% 1.94% 4.35% 149.68% 165.45% 24.71% 23.02% 5.51% 1 1.86% 1 Industry Benchmarks Source: Dybek, M. (2019. June 29). General Mills Inc. (NYSE:GIS 2 General MIIS, INC. (2019). 2019 annual report. Minneapolis, MN
Step by Step Solution
There are 3 Steps involved in it
1 Expert Approved Answer
Step: 1 Unlock

Question Has Been Solved by an Expert!
Get step-by-step solutions from verified subject matter experts
Step: 2 Unlock
Step: 3 Unlock