

Question: Based on the graph, complete the table that follows: 20.0 16.0 12.0 8.0 O 4.0 2.0 1.5 1.0 0.5 RISK (Beta) Value CAPM Elements Risk-free
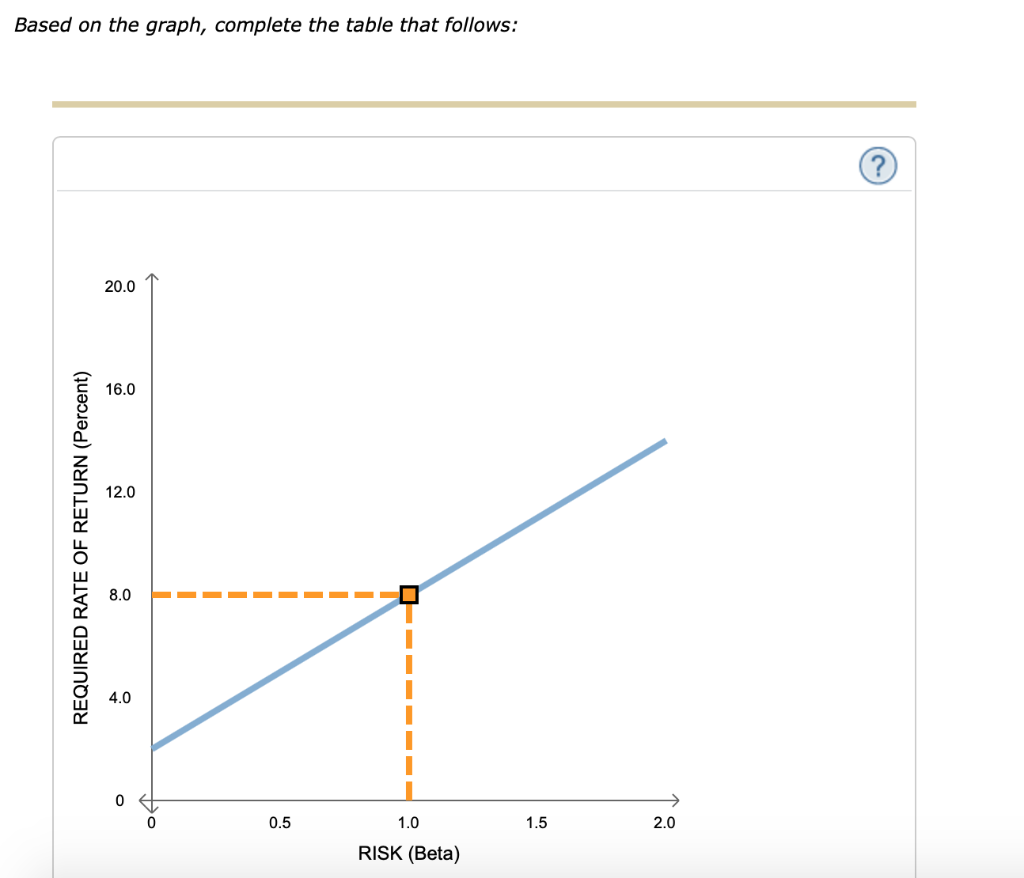
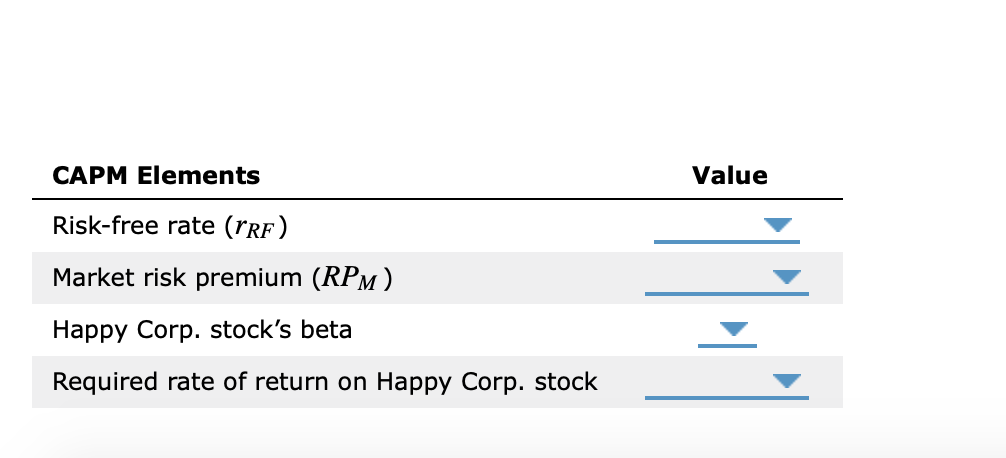
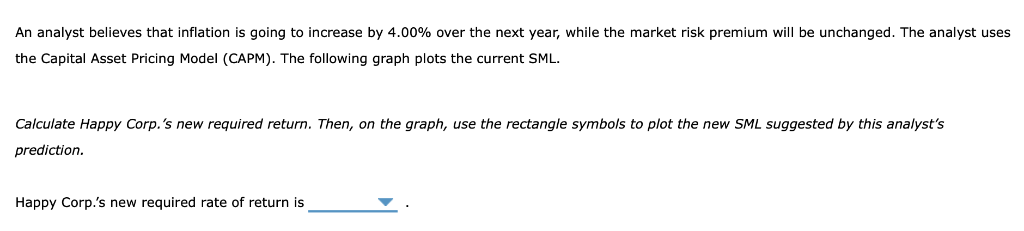
Based on the graph, complete the table that follows: 20.0 16.0 12.0 8.0 O 4.0 2.0 1.5 1.0 0.5 RISK (Beta) Value CAPM Elements Risk-free rate (rRF) Market risk premium (RPM) Happy Corp. stock's beta Required rate of return on Happy Corp. stock An analyst believes that inflation is going to increase by 4.00% over the next year, while the market risk premium will be unchanged. The analyst uses the Capital Asset Pricing Model (CAPM). The following graph plots the current SML Calculate Happy Corp.'s new required return. Then, on the graph, use the rectangle symbols to plot the new SML suggested by this analyst's prediction Happy Corp.'s new required rate of return is Based on the graph, complete the table that follows: 20.0 16.0 12.0 8.0 O 4.0 2.0 1.5 1.0 0.5 RISK (Beta) Value CAPM Elements Risk-free rate (rRF) Market risk premium (RPM) Happy Corp. stock's beta Required rate of return on Happy Corp. stock An analyst believes that inflation is going to increase by 4.00% over the next year, while the market risk premium will be unchanged. The analyst uses the Capital Asset Pricing Model (CAPM). The following graph plots the current SML Calculate Happy Corp.'s new required return. Then, on the graph, use the rectangle symbols to plot the new SML suggested by this analyst's prediction Happy Corp.'s new required rate of return is
Step by Step Solution
There are 3 Steps involved in it

Get step-by-step solutions from verified subject matter experts