

Question: (based on the graphs below) 1. Why is the Stem Plot not a suitable graph to use to describe these data? 2. How did these
(based on the graphs below)
1. Why is the Stem Plot not a suitable graph to use to describe these data?
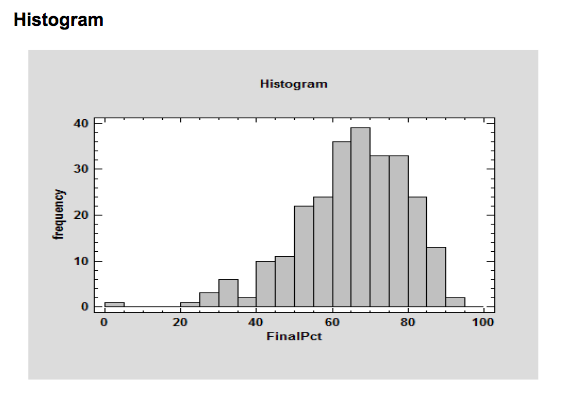
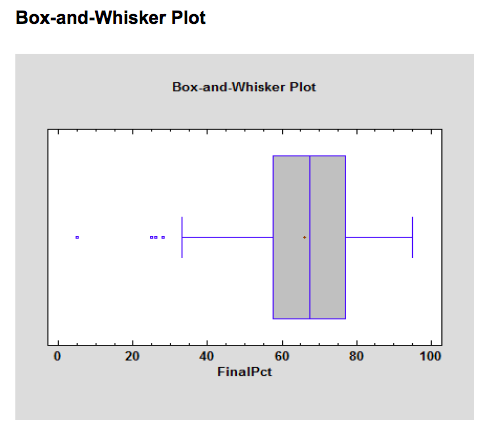
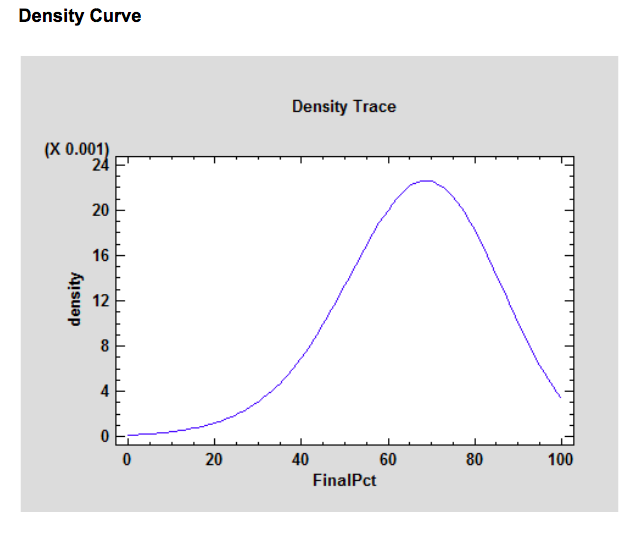
2. How did these students performed in the final exam? To help you answer the question, describe the distribution of FinalPct in terms of centre, spread, and shape. Refer to the output to justify your description. Remember that your description must be in the context of the problem. (e.g., you can't just say that the shape of the distribution is left-skewed. You have to explain what a left-skewed distribution says about how the students did in their final exam.
\f\f\f
Step by Step Solution
There are 3 Steps involved in it
1 Expert Approved Answer
Step: 1 Unlock

Question Has Been Solved by an Expert!
Get step-by-step solutions from verified subject matter experts
Step: 2 Unlock
Step: 3 Unlock