

Question: Based on the historical shoreline data ( Source: NOAA ) with the plotted shoreline positions, transect and baseline ( Fig . 1 ) , compute
Based on the historical shoreline data Source: NOAA with the plotted
shoreline positions, transect and baseline Fig compute the shoreline
change using the following methods;
a Linear Regression Rate LLR
Estimate the shoreline change rate by plotting the shoreline positions with
respect to time Distance from baseline, axis, vs Time, axis
Generate a linear trend and the slope of the equation describes the rate.
b End Point Rate EPR
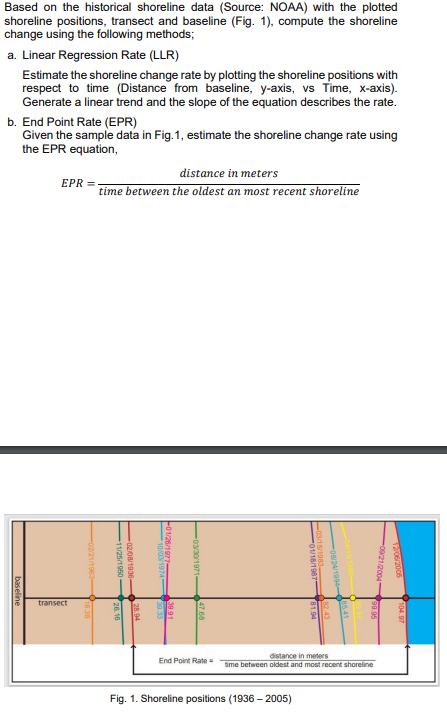
Given the sample data in Fig estimate the shoreline change rate using
the EPR equation,
EPR
Fig. Shoreline positions
Step by Step Solution
There are 3 Steps involved in it
1 Expert Approved Answer
Step: 1 Unlock

Question Has Been Solved by an Expert!
Get step-by-step solutions from verified subject matter experts
Step: 2 Unlock
Step: 3 Unlock