

Question: Based on the horizontal and vertical analysis , identify at least three possible red flags and indicate if a reasonable explanation exists in 12 sentences
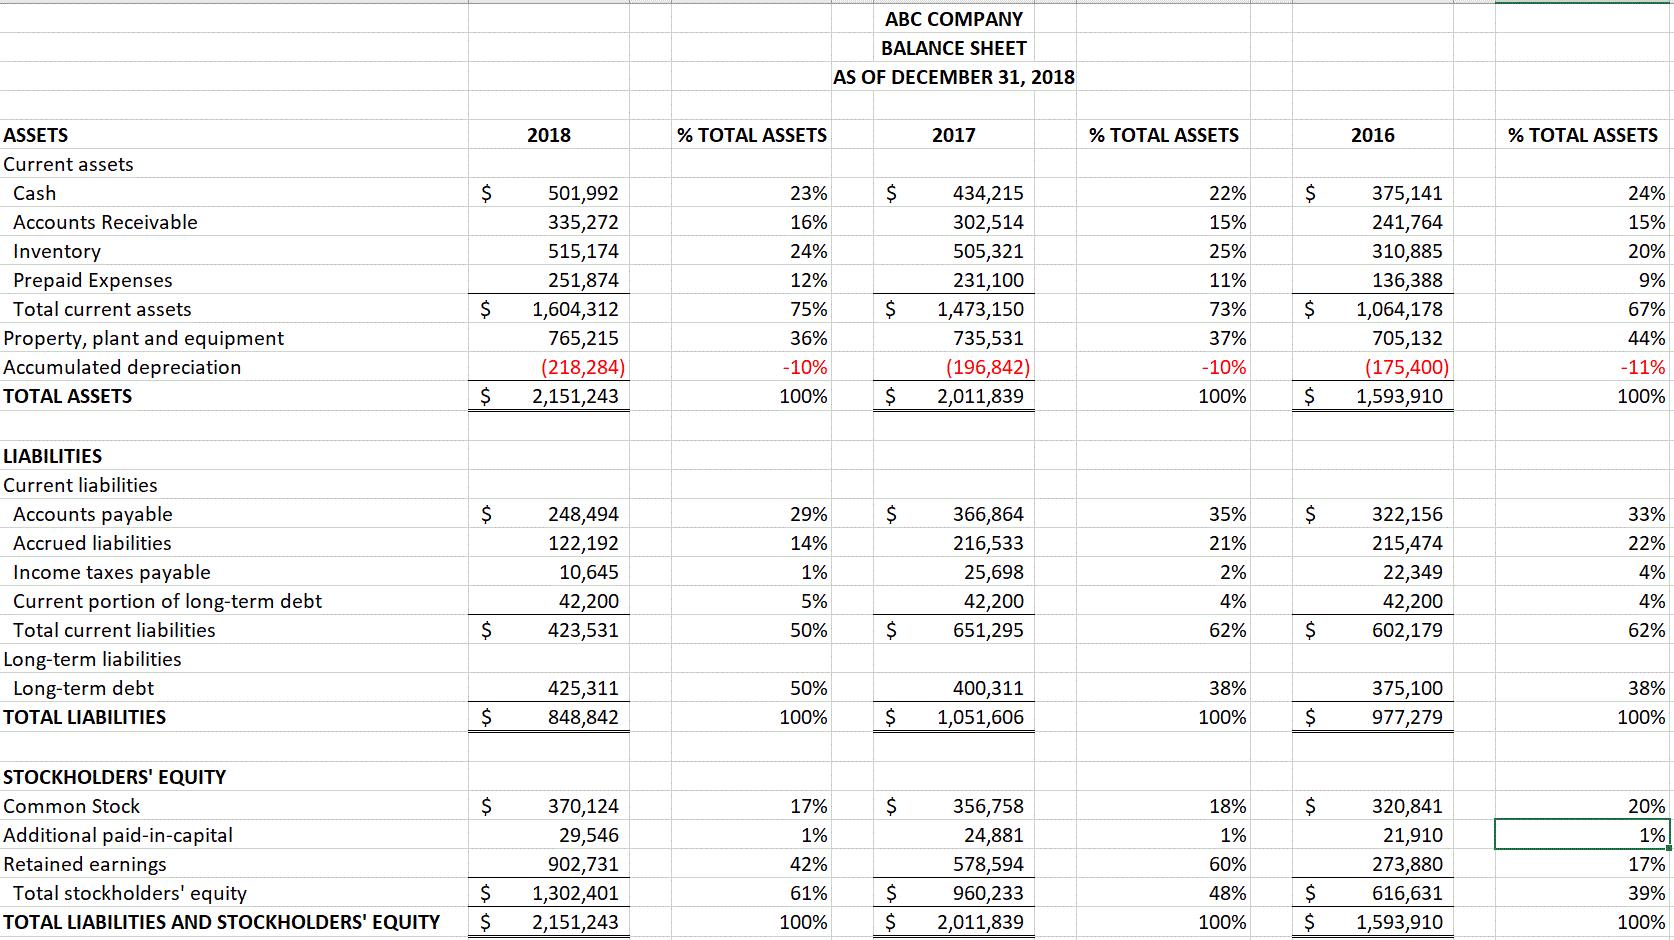
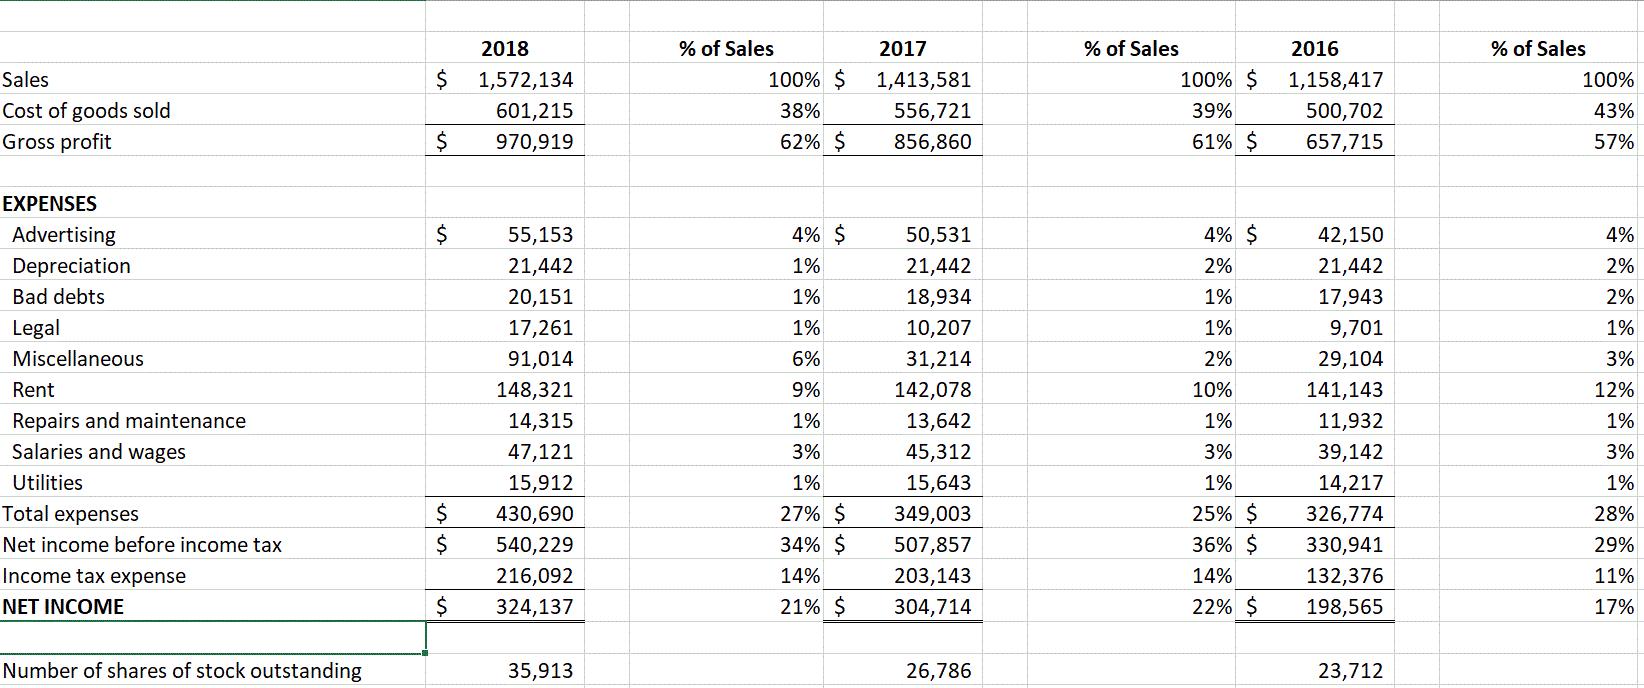
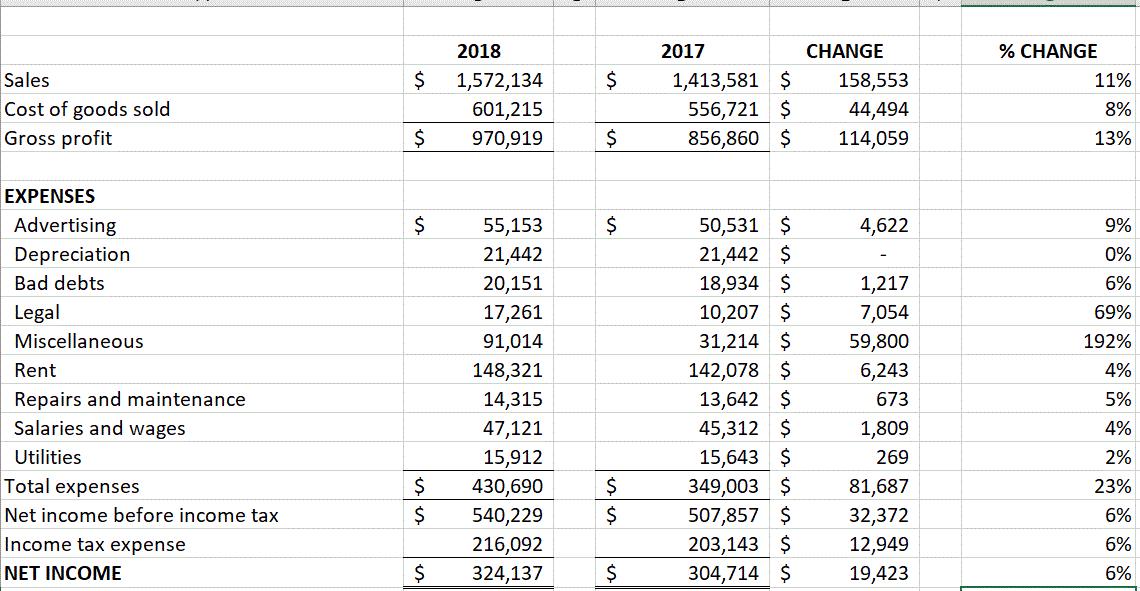
- Based on the horizontal and vertical analysis, identify at least three possible red flags and indicate if a reasonable explanation exists in 1–2 sentences for each of the areas of concern you choose.
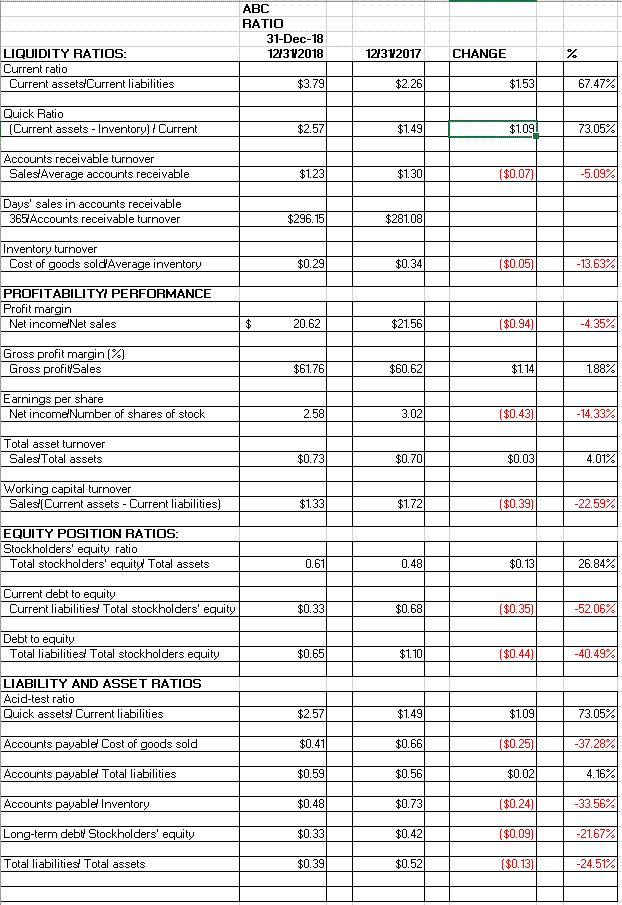
- Based on the ratio worksheet analysis, indicate at least three ratio areas where you can identify that liability understatement fraud may have occurred. Provide specific details in your paragraph explanation of each ratio, including horizontal and/or vertical analysis changes that support the concerns raised by the selected ratios.
- Based on the ratio worksheet analysis, indicate at least 3 ratio areas where you can identify that asset overstatement fraud may have occurred. Provide specific details in your paragraph explanation of each ratio, including horizontal and/or vertical analysis changes that support the concerns raised by the selected ratios.
- Based on the ratio worksheet analysis, indicate at least three ratio areas where you can identify revenue fraud that may have occurred. Provide specific details in your paragraph explanation of each ratio, including horizontal and/or vertical analysis changes that support the concerns raised by the selected ratios.
- Based on the ratio worksheet analysis, indicate at least three areas where you can identify inventory fraud that may have occurred. Provide specific details in your paragraph explanation of each ratio, including horizontal and/or vertical analysis changes that support the concerns raised by the selected ratios
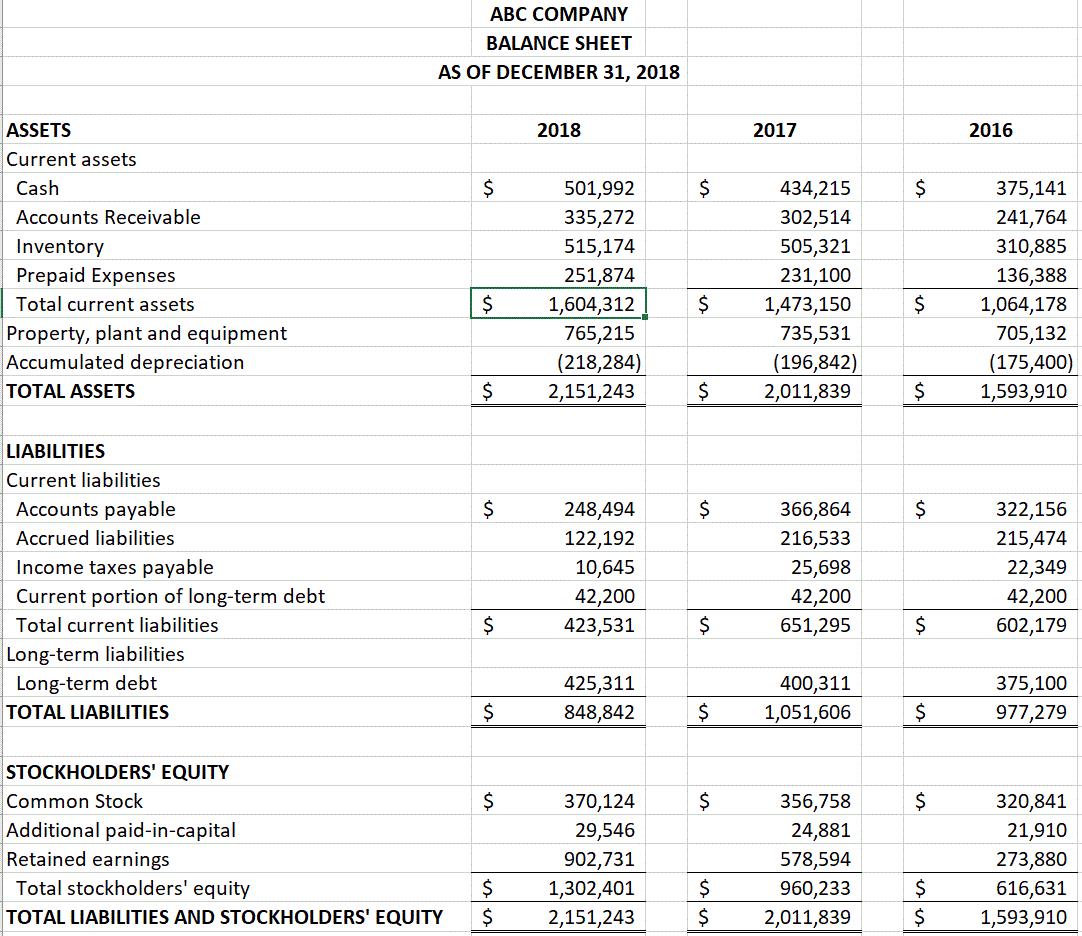
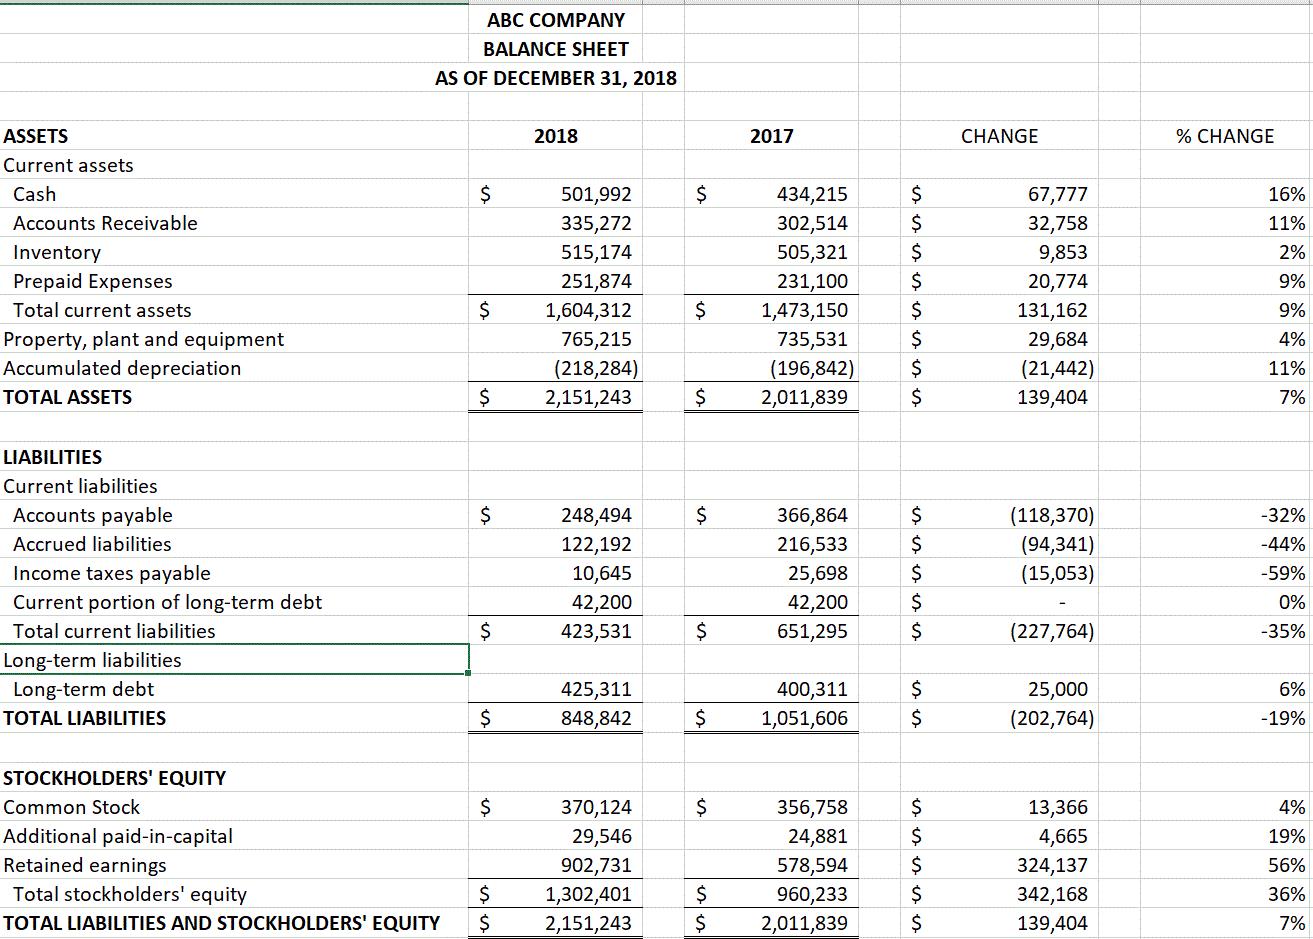
ABC COMPANY BALANCE SHEET AS OF DECEMBER 31, 2018 ASSETS Current assets Cash Accounts Receivable Inventory 2018 2017 2016 $ 501,992 $ 434,215 $ 375,141 335,272 302,514 241,764 515,174 505,321 310,885 Prepaid Expenses 251,874 231,100 136,388 Total current assets $ 1,604,312 $ 1,473,150 $ 1,064,178 Property, plant and equipment 765,215 735,531 705,132 Accumulated depreciation (218,284) (196,842) (175,400) TOTAL ASSETS $ 2,151,243 $ 2,011,839 $ 1,593,910 LIABILITIES Current liabilities Accounts payable $ 248,494 $ 366,864 $ 322,156 Accrued liabilities 122,192 216,533 215,474 Income taxes payable 10,645 25,698 22,349 Current portion of long-term debt 42,200 42,200 42,200 Total current liabilities $ 423,531 651,295 $ 602,179 Long-term liabilities Long-term debt 425,311 400,311 375,100 TOTAL LIABILITIES $ 848,842 $ 1,051,606 $ 977,279 STOCKHOLDERS' EQUITY Common Stock $ 370,124 356,758 $ 320,841 Additional paid-in-capital 29,546 24,881 21,910 Retained earnings 902,731 578,594 273,880 Total stockholders' equity $ 1,302,401 $ 960,233 616,631 TOTAL LIABILITIES AND STOCKHOLDERS' EQUITY $ 2,151,243 $ 2,011,839 $ 1,593,910
Step by Step Solution
3.29 Rating (155 Votes )
There are 3 Steps involved in it
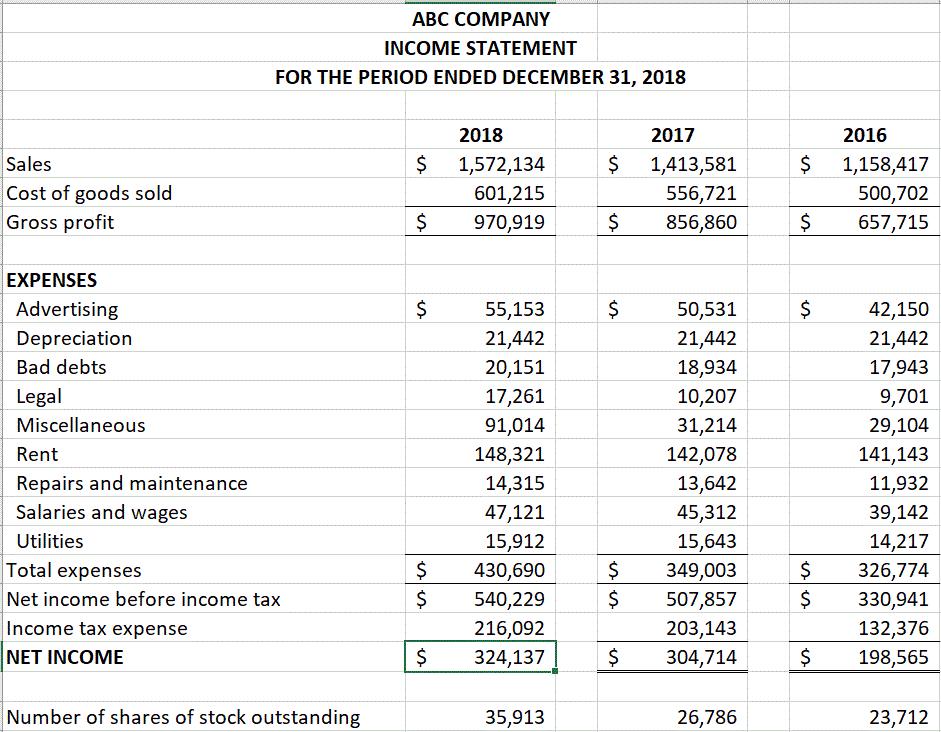
Based on the provided financial data here are some potential red flags and reasonable explanations Possible Red Flags 1 Significant increase in miscellaneous expenses 192 increase from 2017 to 2018 A ... View full answer

Get step-by-step solutions from verified subject matter experts