

Question: Based on the information below, what two cities would be best to open 2 new office Formulas Data Review View 2% Cut Calibri (Body) .
Based on the information below, what two cities would be best to open 2 new office
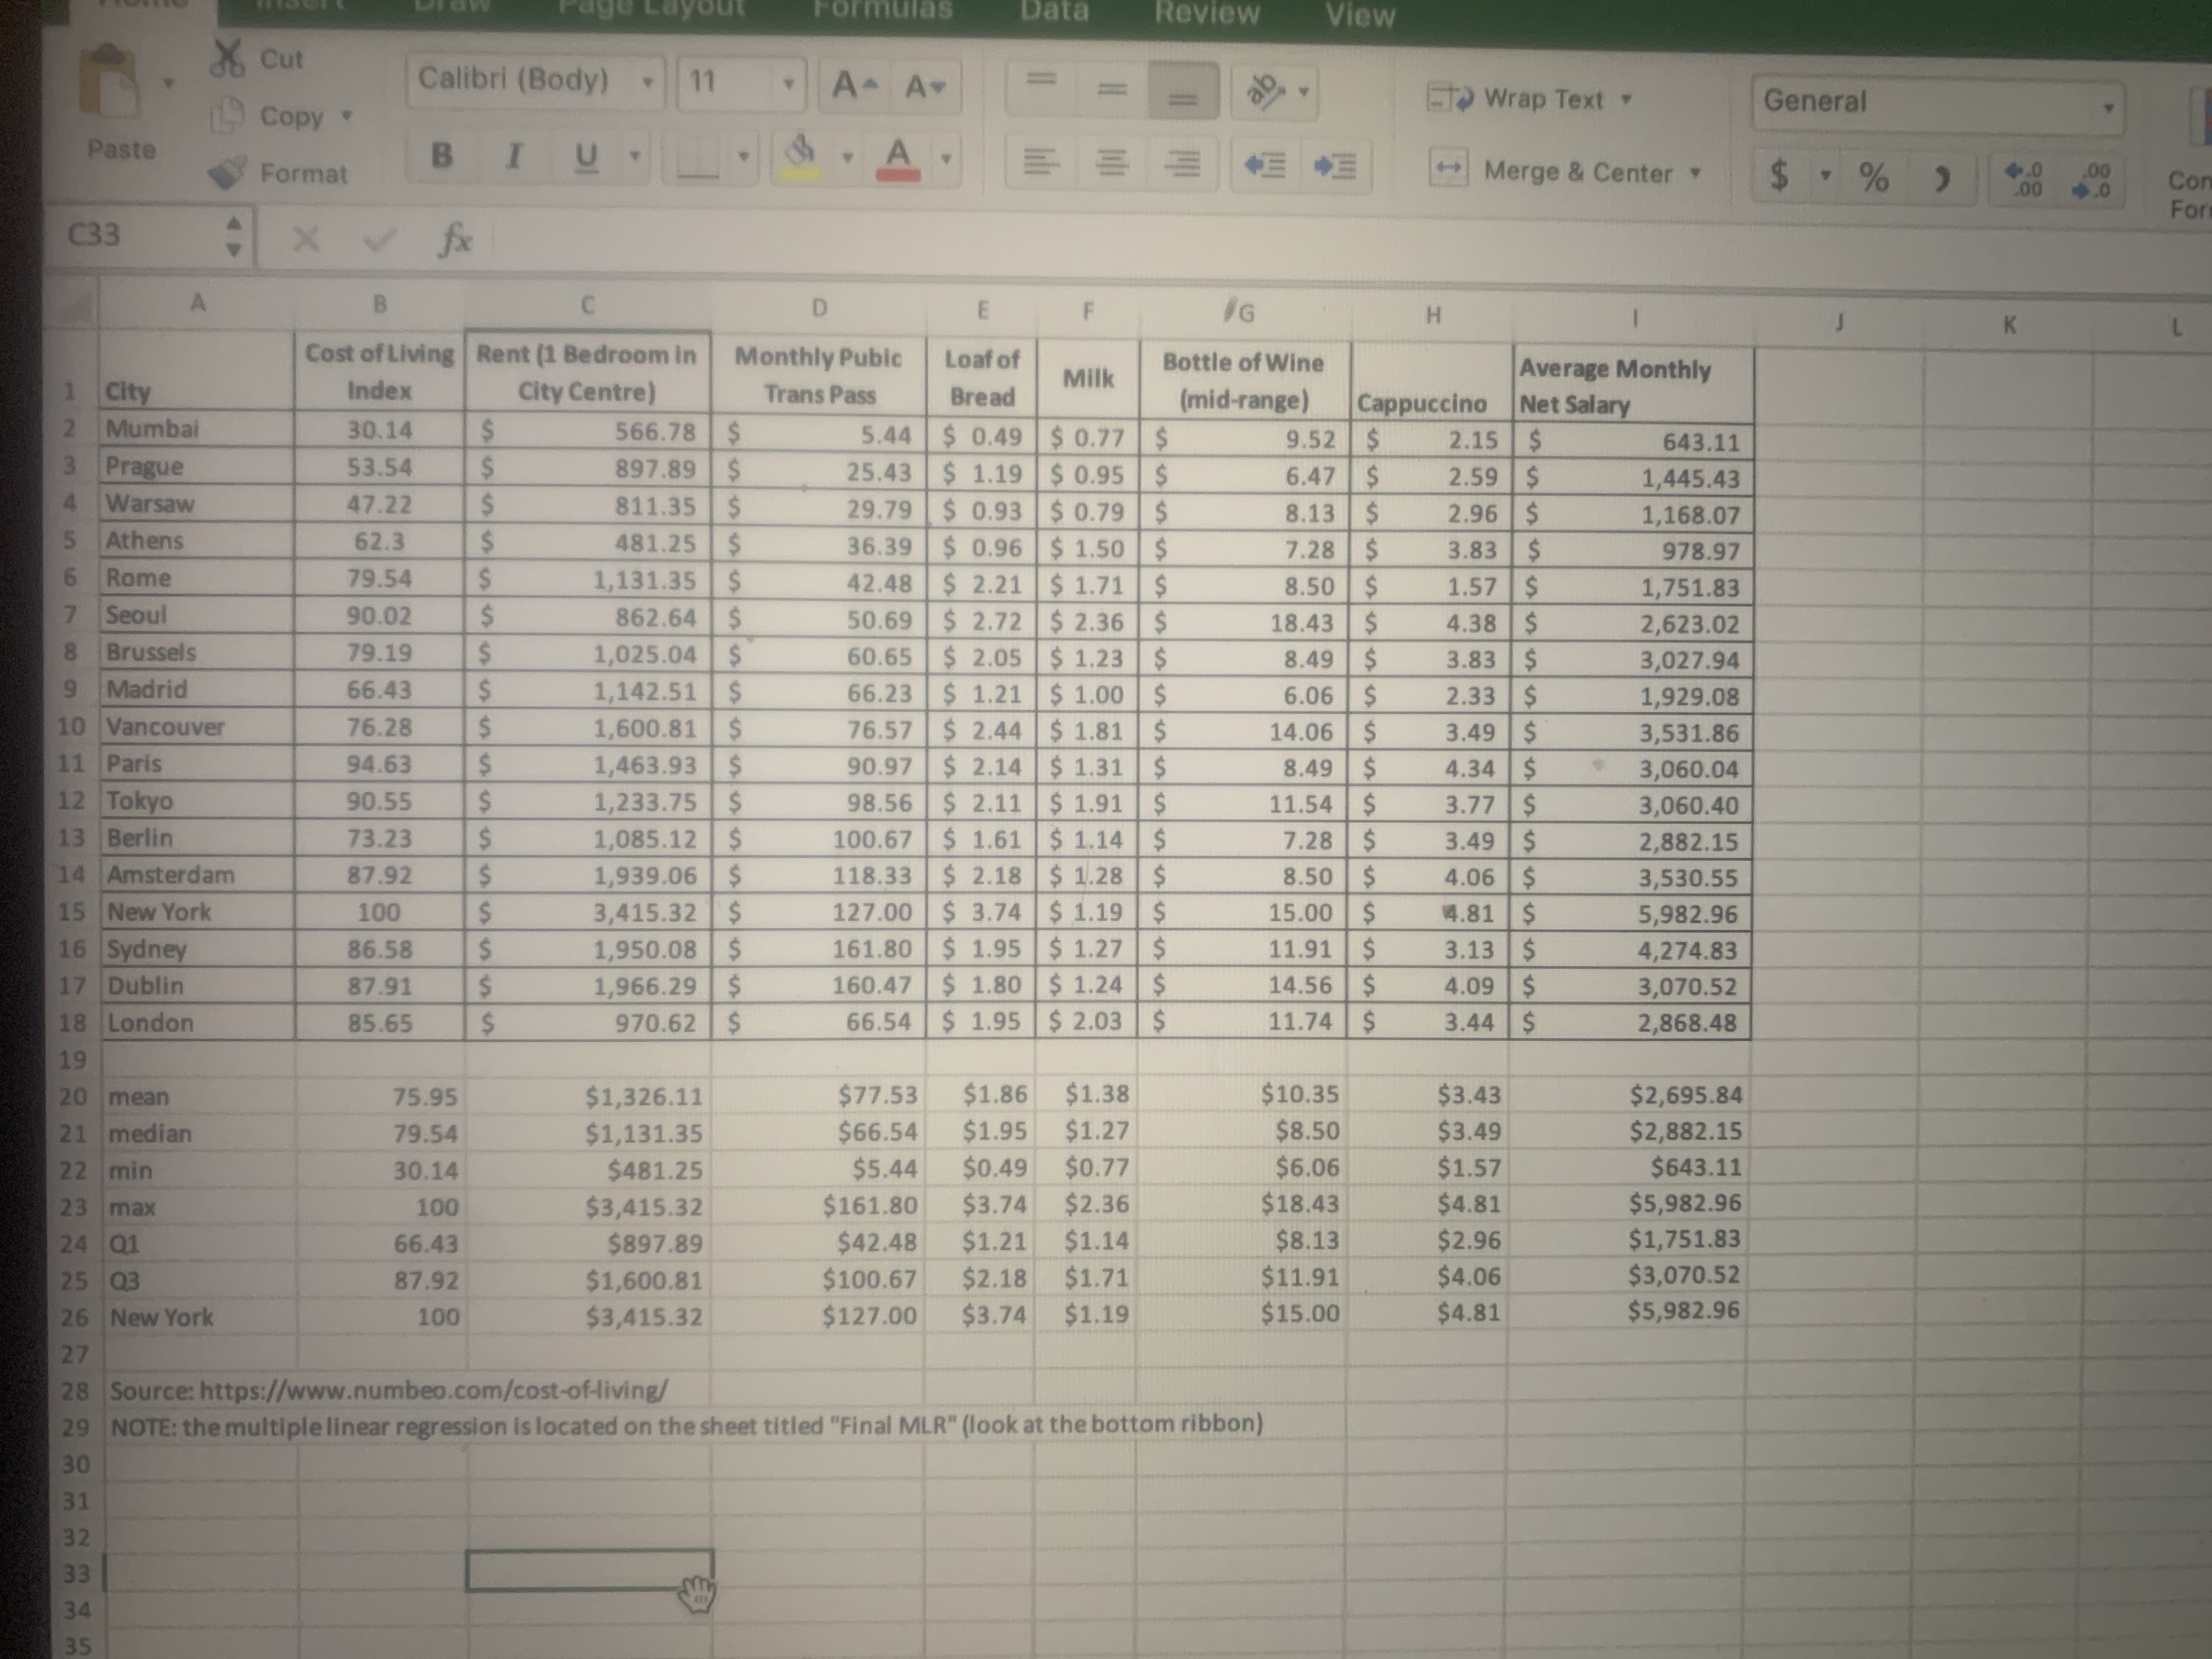
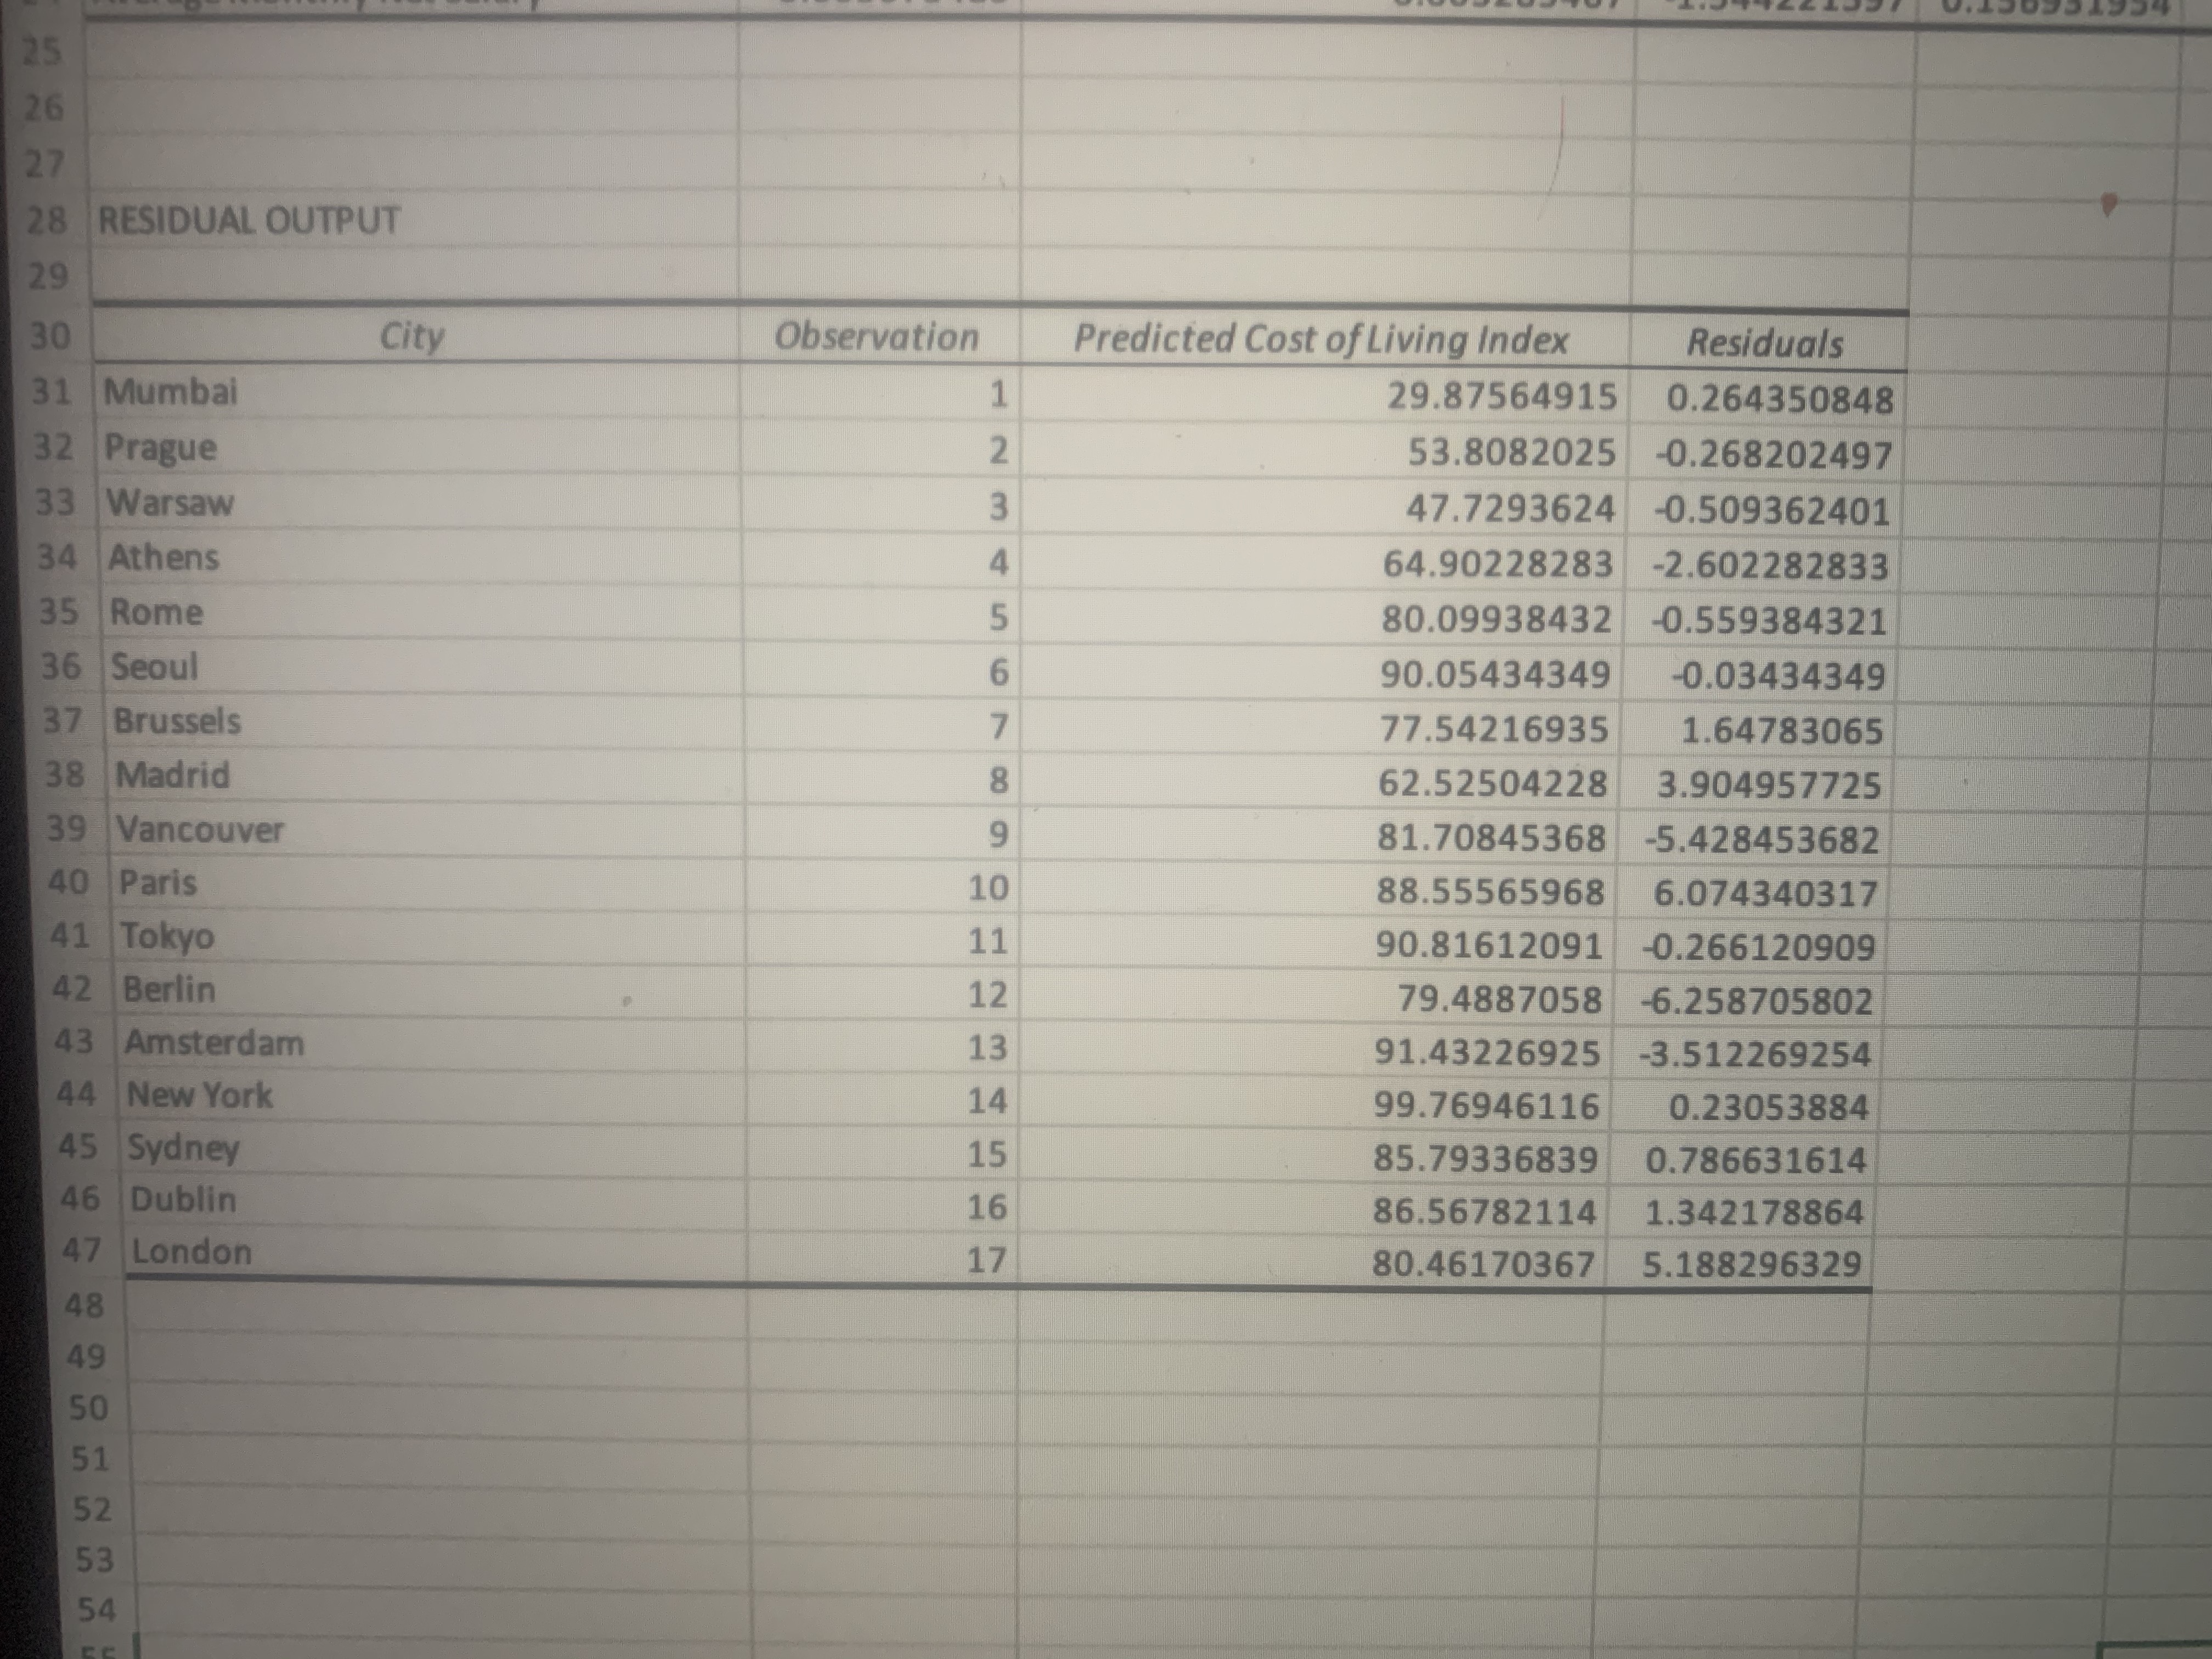
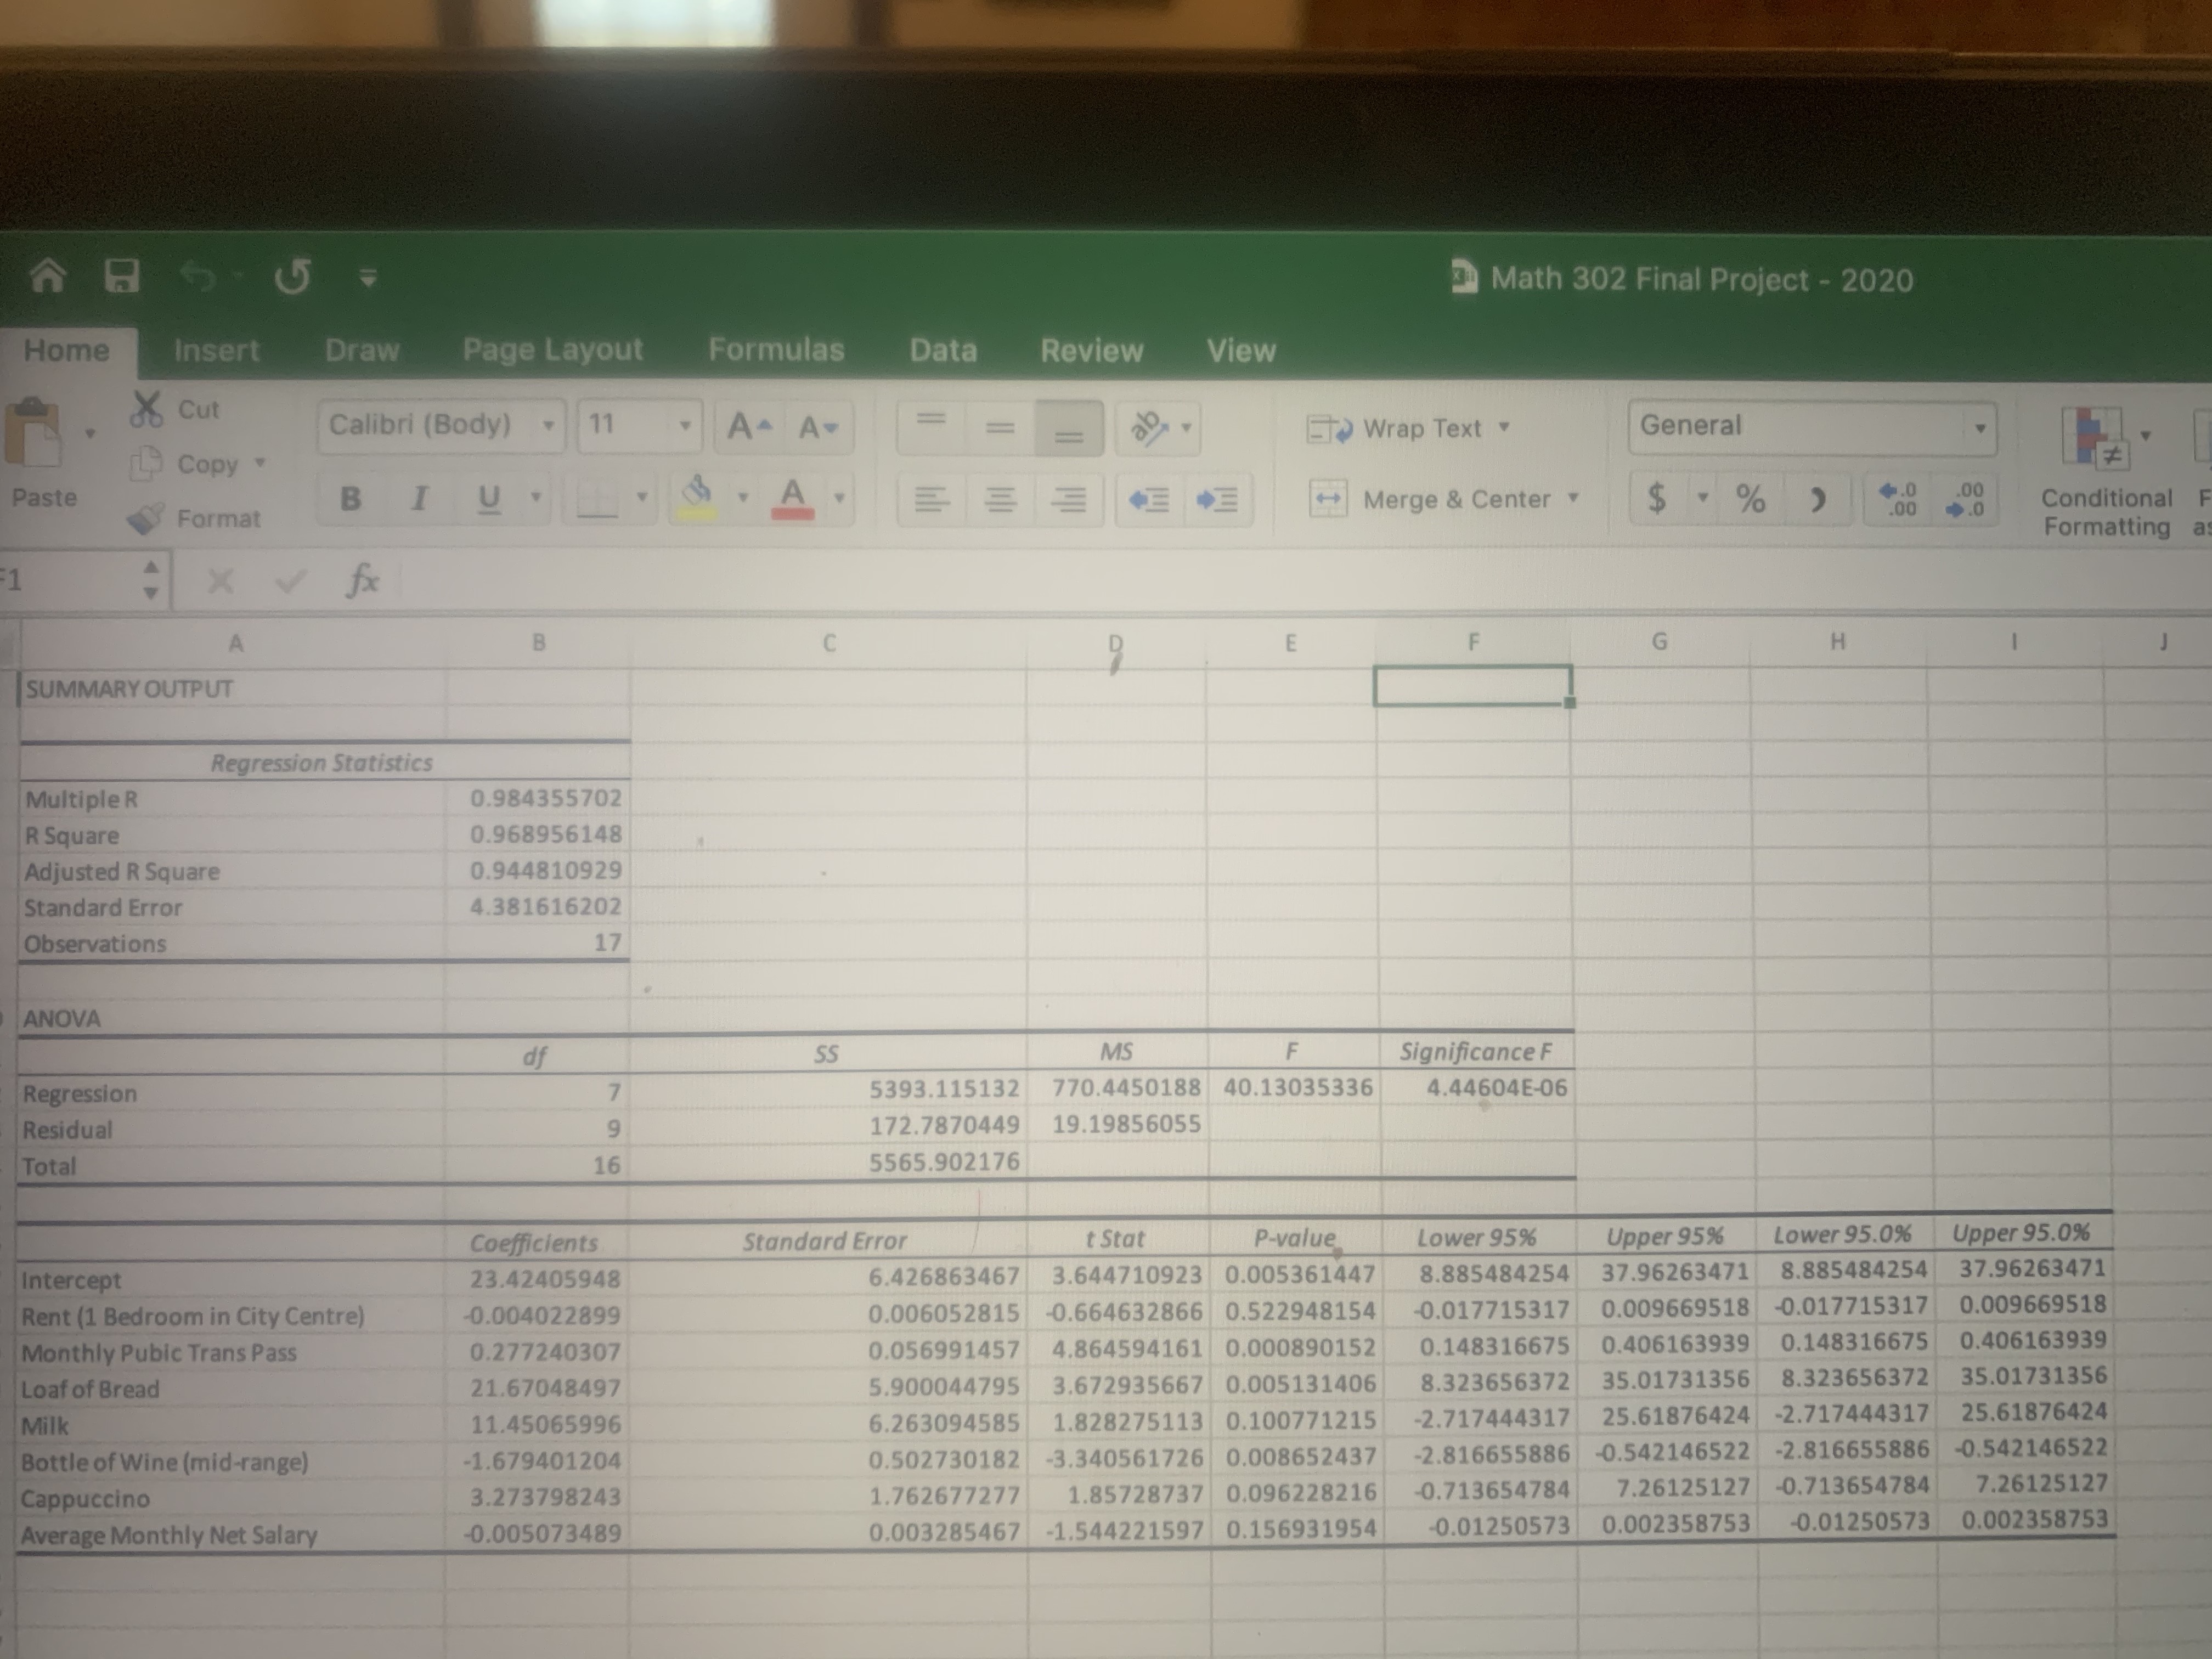
Formulas Data Review View 2% Cut Calibri (Body) . 11 . A- A Copy . = Wrap Text . General Paste Format B I U . . . A . |Merge & Center $ % 00 00 .0 Co C33 For x v fix C D IG H K Cost of Living Rent (1 Bedroom in Monthly Pubic Loaf of Bottle of Wine Average Monthly City Index City Centre) Trans Pass Mill Bread (mid-range) Cappuccino Mumbai Net Salary 2 30.14 566.78 $ 5.44 $ 0.49 $ 0.77 $ 9.52 $ 2.15 $ 643.11 3 Prague 53.54 897.89 $ 25.43 $ 1.19 $ 0.95 $ 6.47 $ 2.59 $ 1,445.43 4 Warsaw 47.22 811.35 $ 29.79 $ 0.93 $ 0.79 $ 3.13 $ 2.96 $ 1,168.07 5 Athens 62.3 481.25 $ 36.39 $ 0.96 $ 1.50 $ 7.28 $ 3.83 $ 978.97 6 Rome 79.54 1,131.35 $ 42.48 $ 2.21 $ 1.71 $ 8.50 $ 1.57 5 1,751.83 7 Seoul 90.02 862.64 $ 50.69 $ 2.72 $ 2.36 $ 18.43 $ 4.38 $ 2,623.02 8 Brussels 79.19 1,025.04 $ 60.65 $ 2.05 $ 1.23 $ 8.49 $ 3.83 $ 3,027.94 9 Madrid 56.43 1,142.51 $ 66.23 $ 1.21 $ 1.00 $ 6.06 $ 2.33 $ 1,929.08 10 Vancouver 76.28 1,600.81 $ 76.57 $ 2.44 $ 1.81 $ 14.06 $ 3.49 $ 3,531.86 11 Paris 94.63 1,463.93 $ 90.97 $ 2.14 $ 1.31 $ 8.49 $ 4.34 $ 3,060.04 12 Tokyo 90.55 in in in in in in in 1,233.75 $ 98.56 $ 2.11 $ 1.91 $ 11.54 $ 3.77 $ 3,060.40 13 Berlin 73.23 1,085.12 $ 100.67 $ 1.61 $ 1.14 $ 7.28 $ 3.49 $ 2,882.15 14 Amsterdam 87.92 1,939.06 $ 118.33 $ 2.18 $ 1.28 $ 8.50 $ 4.06 $ 3,530.55 15 New York 100 3,415.32 $ 127.00 $ 3.74 $ 1.19 $ 15.00 $ 4.81 $ 5,982.96 16 Sydney 86.58 1,950.08 $ 161.80 $ 1.95 $ 1.27 $ 11.91 $ 3.13 $ 4,274.83 17 Dublin 87.91 $ ,966.29 $ 160.47 $ 1.80 $ 1.24 $ 14.56 $ 4.09 $ 3,070.52 18 London 85.65 S 970.62 $ 66.54 $ 1.95 $ 2.03 $ 11.74 $ 3.44 $ 2,868.48 19 20 mean 75.95 $1,326.11 $77.53 $1.86 $1.38 $10.35 $3.43 $2,695.84 21 median 79.54 $1,131.35 $66.54 $1.95 $1.27 $8.50 $3.49 $2,882.15 22 min 30.14 $481.25 $5.44 $0.49 $0.77 $6.06 $1.57 $643.11 23 max 100 $3,415.32 $161.80 $3.74 $2.36 $18.43 $4.81 $5,982.96 24 Q1 66.43 $897.89 $42.48 $1.21 $1.14 $8.13 $2.96 $1,751.83 25 Q3 87.92 $1,600.81 $100.67 $2.18 $1.71 $11.91 $4.06 $3,070.52 26 New York 100 $3,415.32 $127.00 $3.74 $1.19 $15.00 $4.81 $5,982.96 27 28 Source: https://www.number.com/cost-of-living/ 29 NOTE: the multiple linear regression is located on the sheet titled "Final MLR" (look at the bottom ribbon) 30 31 33 3425 26 27 28 RESIDUAL OUTPUT 29 30 City Observation Predicted Cost of Living Index Residuals Mumbai 1 29.87564915 0.264350848 32 Prague IN 53.8082025 -0.268202497 33 Warsaw 47.7293624 -0.509362401 34 Athens 64.90228283 -2.602282833 UI A 35 Rome 80.09938432 -0.559384321 36 Seoul 90.05434349 -0.03434349 37 Brussels 77.54216935 1.64783065 38 Madrid 62.52504228 3.904957725 39 Vancouver 81.70845368 -5.428453682 40 Paris 10 88.55565968 6.074340317 41 Tokyo 90.81612091 -0.266120909 42 Berlin 79.4887058 -6.258705802 43 Amsterdam 13 91.43226925 -3.512269254 44 New York 14 99.76946116 0.23053884 45 Sydney 15 85.79336839 0.786631614 46 Dublin 16 86.56782114 1.342178864 47 London 17 80.46170367 5.188296329 48 49 50 51 52 53 54Math 302 Final Project - 2020 Home Insert Draw Page Layout Formulas Data Review View X Cut Calibri (Body) * 11 = = Wrap Text . General 9 Copy Paste B I U . A Format E |Merge & Center $ % .00 .00 .0 Conditional Formatting X V fx A B C E F G H SUMMARY OUTPUT Regression Statistics Multiple R 0.984355702 R Square 0.968956148 Adjusted R Square 0.944810929 Standard Error 4.381616202 Observations 17 ANOVA df SS MS F Significance F Regression 7 5393.115132 770.4450188 40.13035336 4.44604E-06 Residual 172.7870449 19.19856055 Tota 16 5565.902176 Coefficients Standard Error t Stat P-value Lower 95% Upper 95% Lower 95.0% Upper 95.0% Intercept 23.42405948 6.426863467 3.644710923 0.005361447 8.885484254 37.96263471 8.885484254 37.96263471 Rent (1 Bedroom in City Centre) 0.004022899 0.006052815 -0.664632866 0.522948154 -0.017715317 0.009669518 -0.017715317 0.009669518 Monthly Pubic Trans Pass 0.277240307 0.056991457 4.864594161 0.000890152 0.148316675 0.406163939 0.148316675 0.406163939 Loaf of Bread 21.67048497 5.900044795 3.672935667 0.005131406 8.323656372 35.01731356 8.323656372 35.01731356 Milk 11.45065996 6.263094585 1.828275113 0.100771215 -2.717444317 25.61876424 -2.717444317 25.61876424 Bottle of Wine (mid-range) -1.679401204 0.502730182 -3.340561726 0.008652437 -2.816655886 -0.542146522 -2.816655886 -0.542146522 Cappuccino 3.273798243 1.762677277 1.85728737 0.096228216 -0.713654784 7.26125127 -0.713654784 7.26125127 Average Monthly Net Salary -0.005073489 0.003285467 -1.544221597 0.156931954 -0.01250573 0.002358753 -0.01250573 0.002358753
Step by Step Solution
There are 3 Steps involved in it

Get step-by-step solutions from verified subject matter experts