

Percentages need to be entered in decimal format, for instance 3% would be entered as .03.) Stock
Fantastic news! We've Found the answer you've been seeking!
Question:
Percentages need to be entered in decimal format, for instance 3% would be entered as .03.)
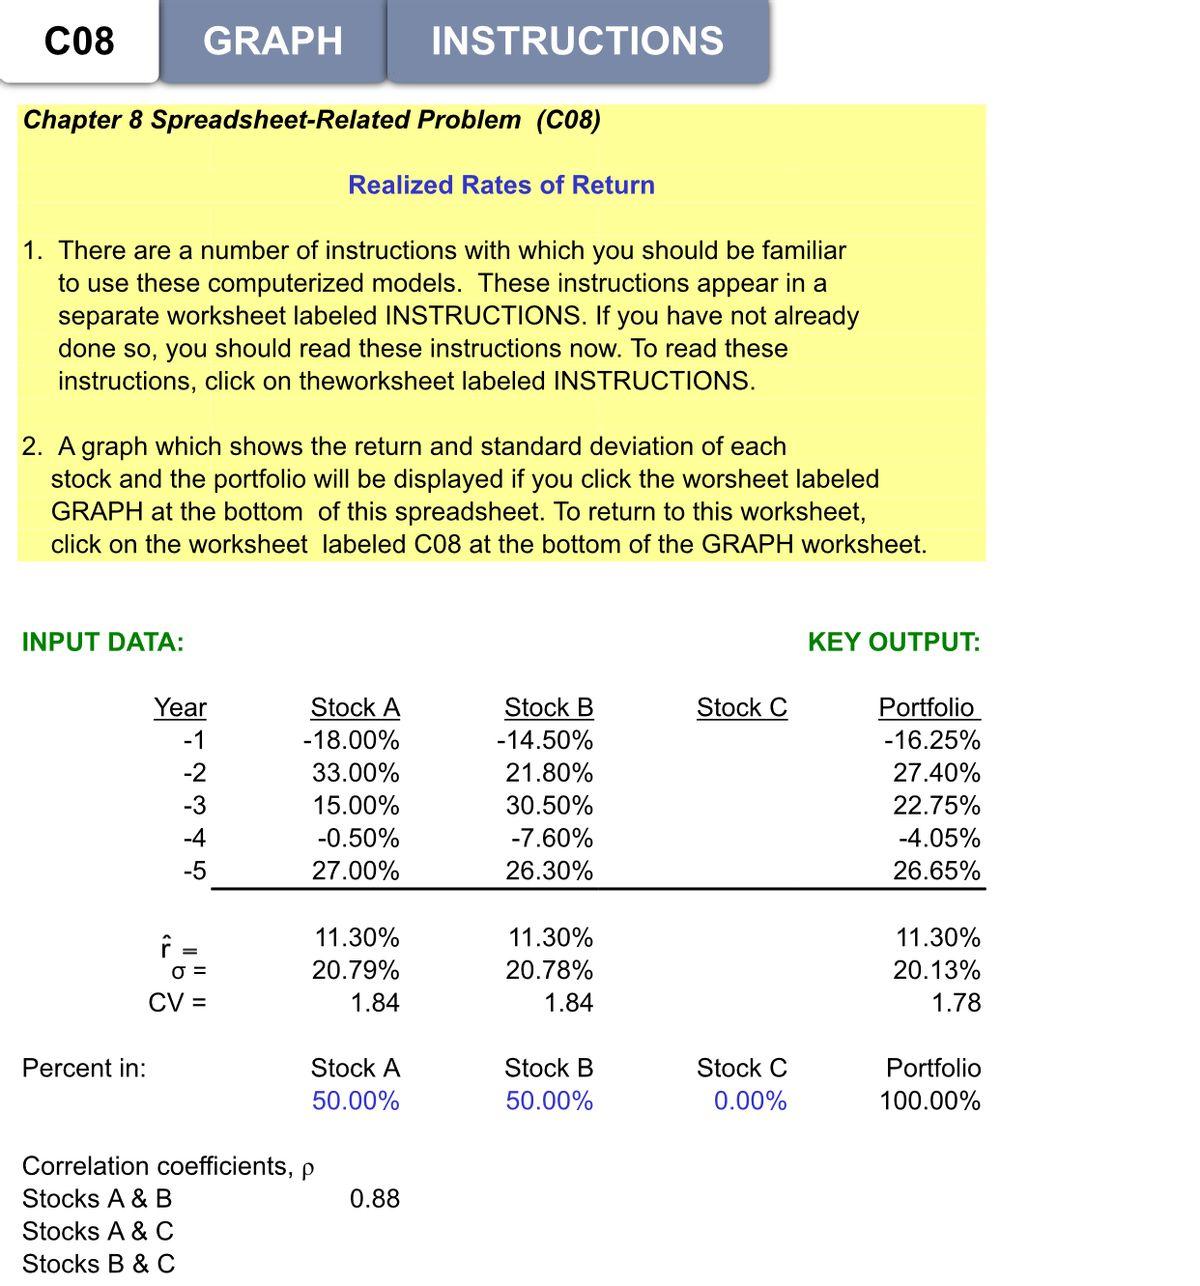
- Stock A and Stock B produced the returns shown on the spreadsheet during the past five years (Year -1 is one year ago, Year -2 is two years ago, and so forth). According to the spreadsheet, what is the average rate of return for each stock during the past five years? (Refer to Row 26 for average rate of return.)
- Based on the information in the spreadsheet, what is the coefficient of variation for each stock and for the portfolio? (Refer to Row 28 for the coefficient of variation.) If you are a risk-averse investor, would you prefer to hold Stock A, Stock B, or the portfolio? Why?
- Consider a third stock, Stock C, that is available for inclusion in the portfolio. Stock C produced the returns shown in the table during the past five years (add this to column D under Stock C). What is the average return, standard deviation, and coefficient of variation for Stock C? (Refer to Row 27 for standard deviation.)
Year Stock C's Return -1 32.00% -2 -11.75% -3 10.75% -4 32.25% -5 -6.75% - Adjust the portfolio to consist of 33.33% Stock A, 33.33% Stock B, and 33.33% Stock C (row 31). How does this change affect the portfolio average rate of return, standard deviation, and coefficient of variation versus when 50% was invested in Stock A and 50% in Stock B?
- Make some other changes in the percentage of stocks in the portfolio (Row 31), making sure that the percentages add up to 100%. For example, you could enter 25% for Stock A, 25% for Stock B, and 50% for Stock C. Notice that the average rate of return for the portfolio remains constant for each scenario, but the standard deviation changes. Would you prefer to hold a portfolio consisting only of Stocks A and B or a portfolio that also includes Stock C? Why or why not?
Expert Answer:

Related Book For 

Posted Date:
