

Question: Based on the matrix generated ... (i) Identify the strengths and weaknesses of the company (ii) Propose strategies for each division/product AutoSave on H2 BCG
Based on the matrix generated ...
(i) Identify the strengths and weaknesses of the company
(ii) Propose strategies for each division/product
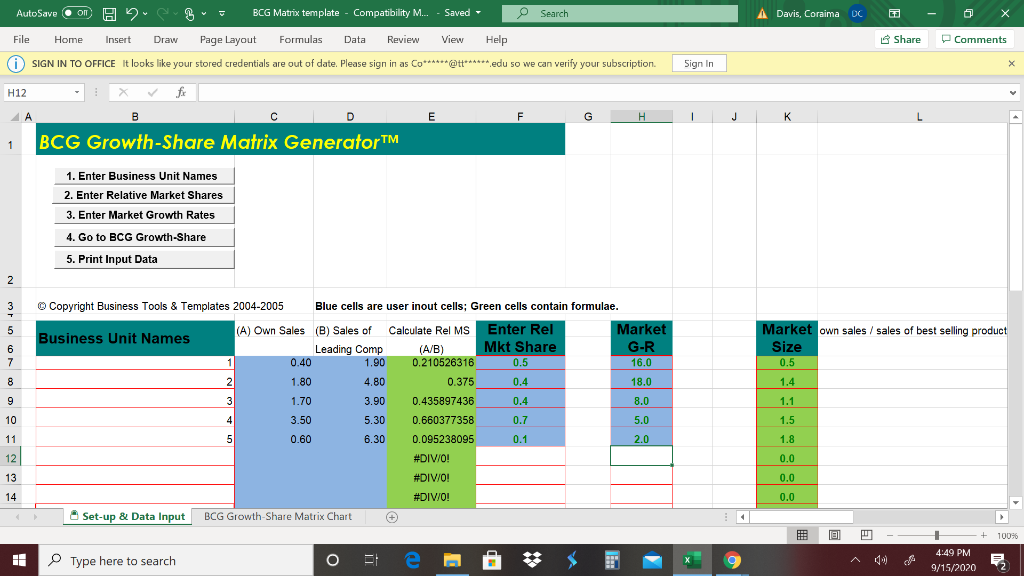
AutoSave on H2 BCG Matrix template - Compatibility M... Saved - O Search A Davis, Coraima DC Ga X File Draw Share Comments Home Insert Page Layout Formulas Data Review View Help SIGN IN TO OFFICE It looks like your stored credentials are out of date. Please sign in as Co******@tt****** edu so we can verify your subscription fic fr Sign In X H12 B E F H 1 J K L 1 BCG Growth-Share Matrix GeneratorTM 1. Enter Business Unit Names 2. Enter Relative Market Shares 3. Enter Market Growth Rates 4. Go to BCG Growth-Share 5. Print Input Data 2 3 5 6 7 Copyright Business Tools & Templates 2004-2005 Blue cells are user inout cells; Green cells contain formulae. (A) Own Sales (B) Sales of Business Unit Names (( Calculate Rel MS Enter Rel Market Leading Comp (A/B) Mkt Share G-R 0.40 1.90 0.210526316 0.5 16.0 2 1.80 4.80 0.375 0.4 18.0 Market own sales/ sales of best selling product Size 0.5 8 1.4 1.1 3 1.70 3.90 0.435897436 0.4 8.0 9 10 4 3.50 5.30 0.660377358 0.7 5.0 1.5 5 0.60 6.30 0.095238095 0.1 2.0 1.8 #DIV/0! 0.0 12 13 #DIV/0! 0.0 14 #DIV/0! 0.0 Set-up & Data Input BCG Growth-Share Matrix Chart jal + 100% I Type here to search O . e 4:49 PM 9/15/2020 AutoSave on H2 BCG Matrix template - Compatibility M... Saved - O Search A Davis, Coraima DC Ga X File Draw Share Comments Home Insert Page Layout Formulas Data Review View Help SIGN IN TO OFFICE It looks like your stored credentials are out of date. Please sign in as Co******@tt****** edu so we can verify your subscription fic fr Sign In X H12 B E F H 1 J K L 1 BCG Growth-Share Matrix GeneratorTM 1. Enter Business Unit Names 2. Enter Relative Market Shares 3. Enter Market Growth Rates 4. Go to BCG Growth-Share 5. Print Input Data 2 3 5 6 7 Copyright Business Tools & Templates 2004-2005 Blue cells are user inout cells; Green cells contain formulae. (A) Own Sales (B) Sales of Business Unit Names (( Calculate Rel MS Enter Rel Market Leading Comp (A/B) Mkt Share G-R 0.40 1.90 0.210526316 0.5 16.0 2 1.80 4.80 0.375 0.4 18.0 Market own sales/ sales of best selling product Size 0.5 8 1.4 1.1 3 1.70 3.90 0.435897436 0.4 8.0 9 10 4 3.50 5.30 0.660377358 0.7 5.0 1.5 5 0.60 6.30 0.095238095 0.1 2.0 1.8 #DIV/0! 0.0 12 13 #DIV/0! 0.0 14 #DIV/0! 0.0 Set-up & Data Input BCG Growth-Share Matrix Chart jal + 100% I Type here to search O . e 4:49 PM 9/15/2020Step by Step Solution
There are 3 Steps involved in it
1 Expert Approved Answer
Step: 1 Unlock

Question Has Been Solved by an Expert!
Get step-by-step solutions from verified subject matter experts
Step: 2 Unlock
Step: 3 Unlock