

Question: Based on the Outputs below for a one-way ANOVA testing that was done Construct a research question that can be answered with this one-way ANOVA
Based on the Outputs below for a one-way ANOVA testing that was done
- Construct a research question that can be answered with this one-way ANOVA testing.
- Evaluate if the ANOVA assumptions of the test are met.
- Comment on the post Hoc tests and the analysis of the strengths of any relationship found (effect size).
- Based on the results, explain what the implications of social change might be
| Case Processing Summary | ||||||
| Cases | ||||||
| Valid | Missing | Total | ||||
| N | Percent | N | Percent | N | Percent | |
| T1 Socio-economic status composite | 5210 | 91.4% | 493 | 8.6% | 5703 | 100.0% |
| Descriptives | |||
| Statistic | Std. Error | ||
| T1 Socio-economic status composite | Mean | .0545 | .01081 |
| 95% Confidence Interval for Mean | Lower Bound | .0333 | |
| Upper Bound | .0757 | ||
| 5% Trimmed Mean | .0360 | ||
| Median | -.0299 | ||
| Variance | .609 | ||
| Std. Deviation | .78061 | ||
| Minimum | -1.75 | ||
| Maximum | 2.57 | ||
| Range | 4.32 | ||
| Interquartile Range | 1.07 | ||
| Skewness | .395 | .034 | |
| Kurtosis | -.028 | .068 |
| Tests of Normality | |||
| Kolmogorov-Smirnova | |||
| Statistic | df | Sig. | |
| T1 Socio-economic status composite | .046 | 5210 | <.001> |
| a. Lilliefors Significance Correction |
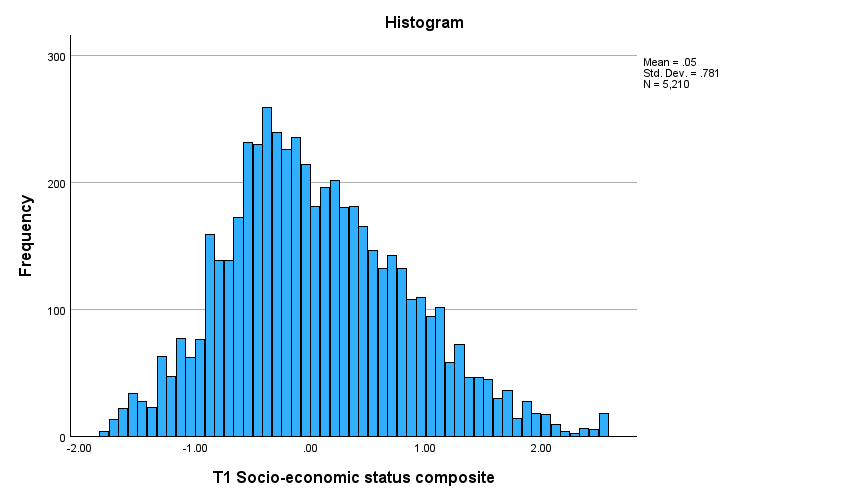
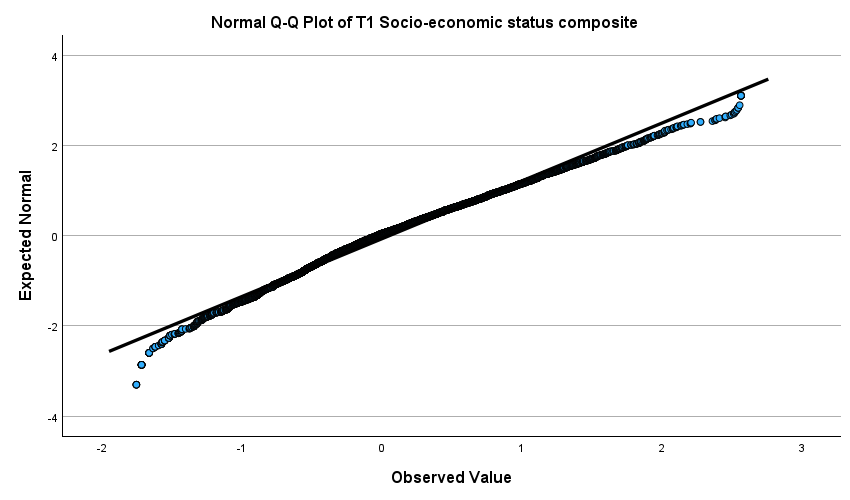
Histogram 300 Mean = .05 Std. Dev. = .781 N = 5,210 200 Frequency 100 -2.00 -1.00 .00 1.00 2.00 T1 Socio-economic status compositeNormal Q-Q Plot of T1 Socio-economic status composite 4 2 Expected Normal -2 O -4 -2 -1 2 3 Observed Value
Step by Step Solution
There are 3 Steps involved in it
1 Expert Approved Answer
Step: 1 Unlock

Question Has Been Solved by an Expert!
Get step-by-step solutions from verified subject matter experts
Step: 2 Unlock
Step: 3 Unlock