

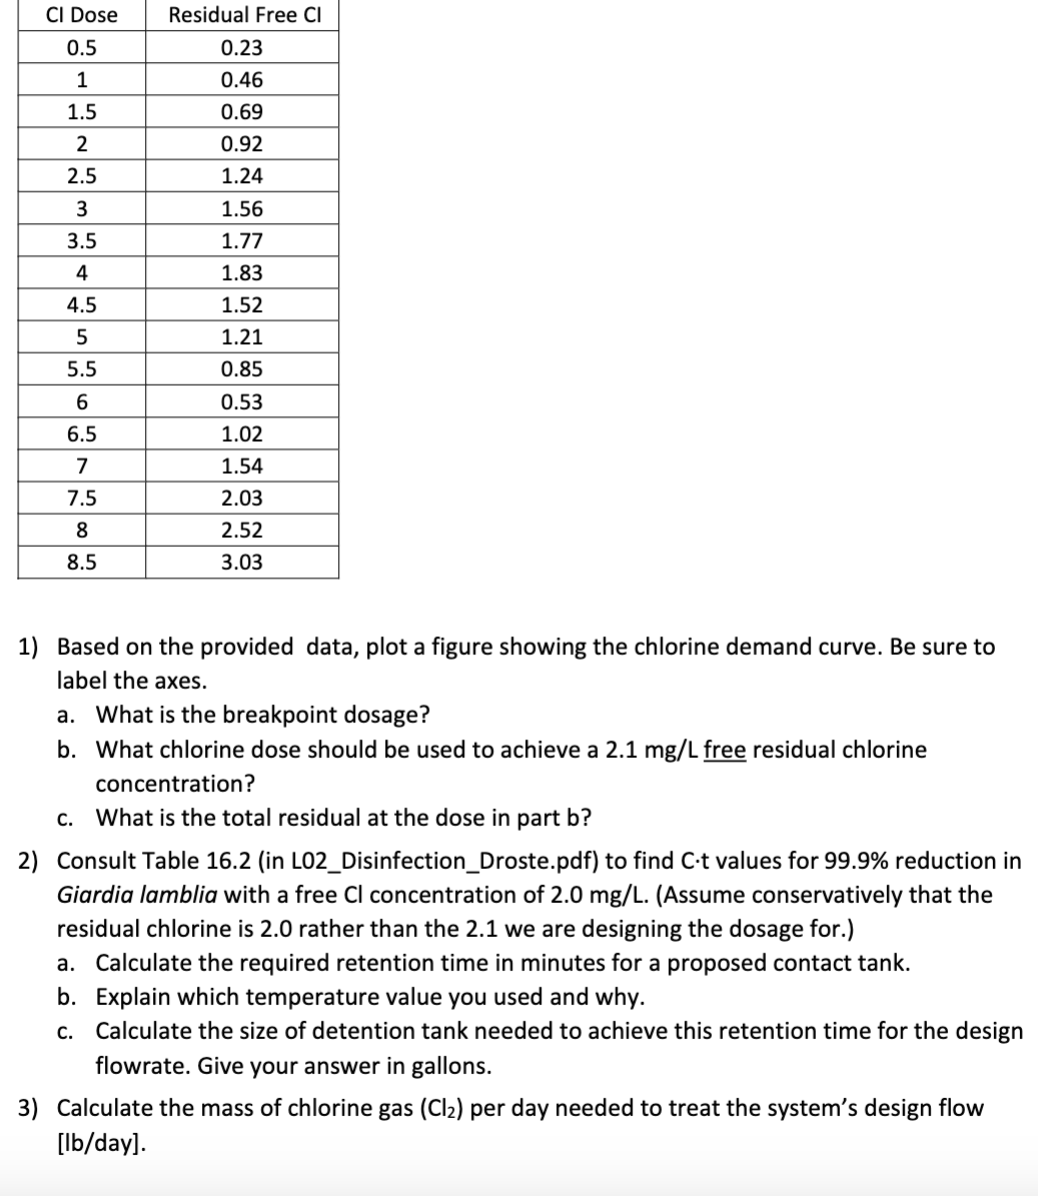
Question: Based on the provided data, plot a figure showing the chlorine demand curve. Be sure to label the axes. a . What is the breakpoint
Based on the provided data, plot a figure showing the chlorine demand curve. Be sure to
label the axes.
a What is the breakpoint dosage?
b What chlorine dose should be used to achieve a free residual chlorine
concentration?
c What is the total residual at the dose in part b
Consult Table in LODisinfectionDroste.pdf to find Ct values for reduction in
Giardia lamblia with a free Cl concentration of Assume conservatively that the
residual chlorine is rather than the we are designing the dosage for.
a Calculate the required retention time in minutes for a proposed contact tank.
b Explain which temperature value you used and why.
c Calculate the size of detention tank needed to achieve this retention time for the design
flowrate. Give your answer in gallons.
Calculate the mass of chlorine gas per day needed to treat the system's design flow
lbday
Step by Step Solution
There are 3 Steps involved in it
1 Expert Approved Answer
Step: 1 Unlock

Question Has Been Solved by an Expert!
Get step-by-step solutions from verified subject matter experts
Step: 2 Unlock
Step: 3 Unlock