

Question: Based on the R output data, what is the correct 94% Bonferonni confidence interval for ? 3- ? 1? If would be great if you
Based on the R output data, what is the correct 94% Bonferonni confidence interval for ?3- ?1?
If would be great if you can explain why the interval (-4.547, -0.692) is not fully correct?
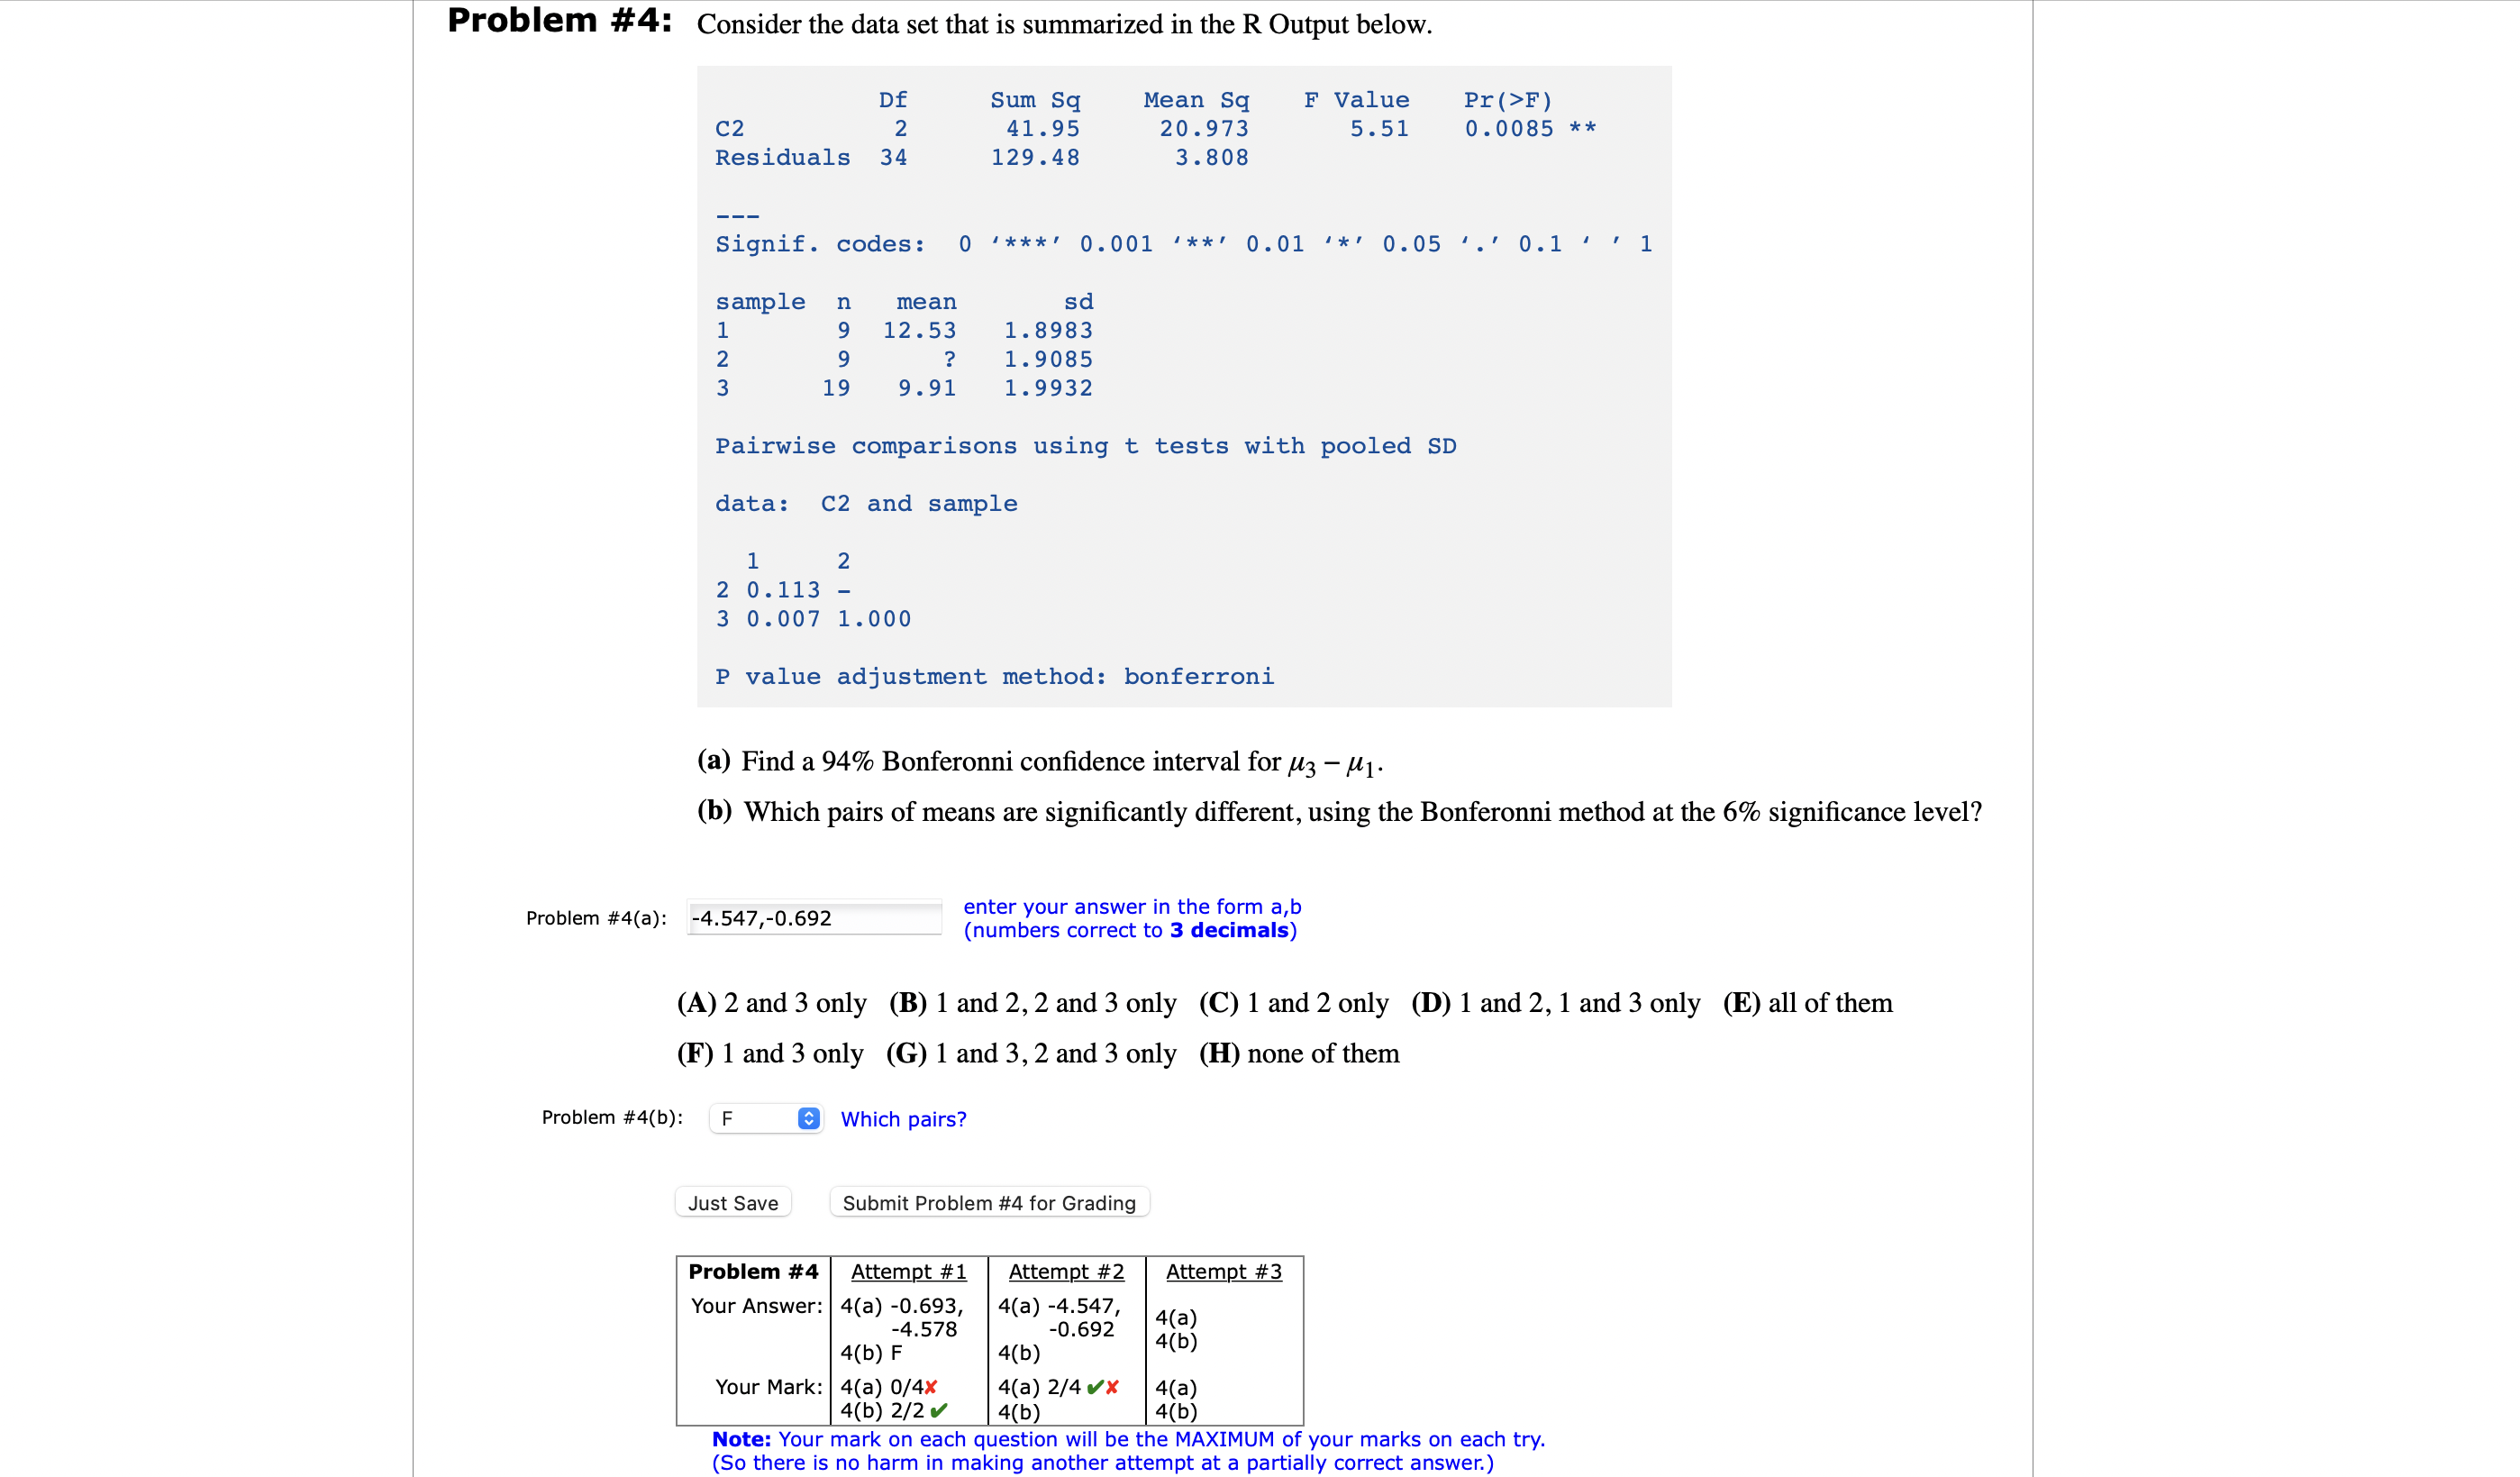
Problem #4: Consider the data set that is summarized in the R Output below. Df Sum Sq Mean Sq F Value Pr(>F) C2 2 41.95 20.973 5. 51 0 . 0085 * * Residuals 34 129 . 48 3. 808 Signif. codes: 0 ' * * * ' 0. 001 . * * ' 0.01 . *' 0.05 . . ' 0.1 ' ' 1 sample n mean sd 1 12.53 1. 8983 2 1. 9085 19 9. 91 1. 9932 Pairwise comparisons using t tests with pooled SD data: C2 and sample 1 2 2 0. 113 3 0. 007 1. 000 P value adjustment method: bonferroni (a) Find a 94% Bonferonni confidence interval for M3 - M1. (b) Which pairs of means are significantly different, using the Bonferonni method at the 6% significance level? Problem #4(a): -4.547,-0.692 enter your answer in the form a,b (numbers correct to 3 decimals) (A) 2 and 3 only (B) 1 and 2, 2 and 3 only (C) 1 and 2 only (D) 1 and 2, 1 and 3 only (E) all of them (F) 1 and 3 only (G) 1 and 3, 2 and 3 only (H) none of them Problem # 4(b): F Which pairs? Just Save Submit Problem #4 for Grading Problem #4 Attempt # 1 Attempt #2 Attempt #3 Your Answer: | 4(a) -0.693, 4(a) -4.547, -4.578 -0.692 4(a) 4(b) F 4(b ) 4(b) Your Mark: 4(a) 0/4x 4(a) 2/4 vX 4(a) 4(b) 2/2 v 4(b 4(b) Note: Your mark on each question will be the MAXIMUM of your marks on each try. (So there is no harm in making another attempt at a partially correct answer.)
Step by Step Solution
There are 3 Steps involved in it

Get step-by-step solutions from verified subject matter experts