

Question: Based on the results shown in Table 1, do you think that the randomization (random assignment of participants to groups) was fully successful? Please circle
Based on the results shown in Table 1, do you think that the randomization (random assignment of participants to groups) was fully successful? Please circle one of the following options:YesNoNotspecified.And please explain your answer (with enough details to justify your response and what it means for the presence of potentially confounding factors).
?
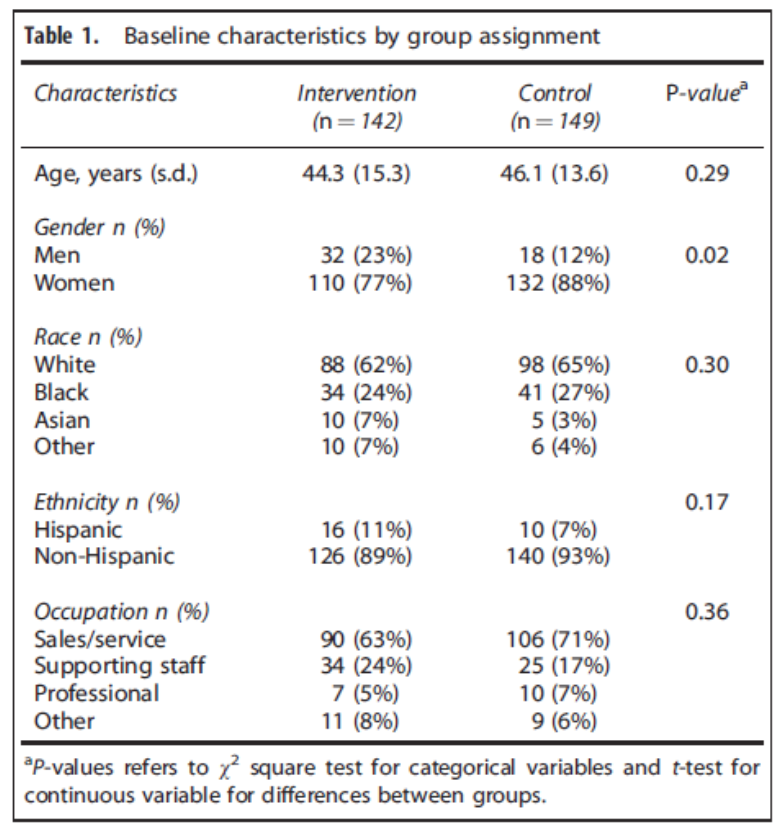
Table 1. Baseline characteristics by group assignment Characteristics Intervention Control P-value (n = 142) (n = 149) Age, years (s.d.) 44.3 (15.3) 46.1 (13.6) 0.29 Gender n (6) Men 32 (23%) 18 (12%) 0.02 Women 110 (77%) 132 (88%) Race n (6) White 88 (62%) 98 (65%) 0.30 Black 34 (24%) 41 (27%) Asian 10 (7%) 5 (3%) Other 10 (7%) 6 (4%) Ethnicity n (6) 0.17 Hispanic 16 (1 1%) 10 (7%) Non-Hispanic 126 (89%) 140 (93%) Occupation n (%) 0.36 Sales/service 90 (63%) 106 (71%) Supporting staff 34 (24%) 25 (17%) Professional 7 (5%) 10 (7%) Other 11 (8%) 9 (6%) P-values refers to x square test for categorical variables and t-test for continuous variable for differences between groups
Step by Step Solution
There are 3 Steps involved in it

Get step-by-step solutions from verified subject matter experts