

Question: Based on the sample data on pizza thickness collected for the 30-day period and presented in table 1, construct an X-bar and R charts. Table
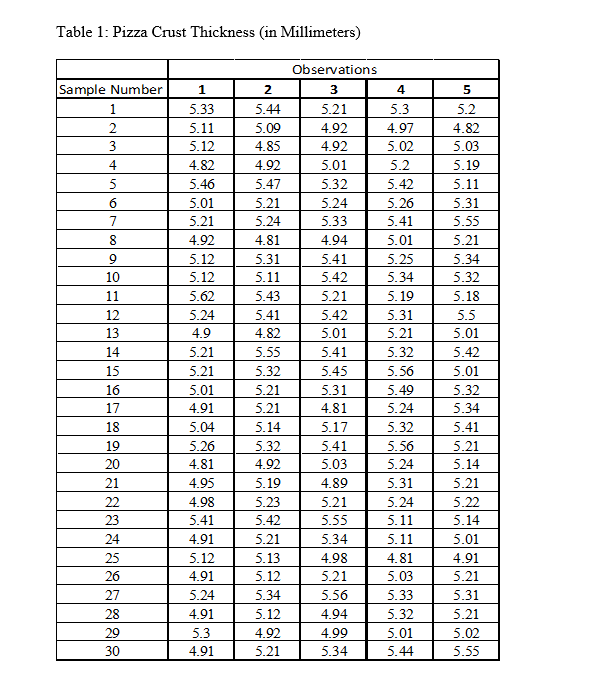
Based on the sample data on pizza thickness collected for the 30-day period and presented in table 1, construct an X-bar and R charts.
Table 1: Pizza Crust Thickness (in Millimeters) 2 5.41 Sample Number 1 2 3 4 5 6 7 8 9 10 11 12 13 14 15 16 17 18 19 20 1 5.33 5.11 5.12 4.82 5.46 5.01 5.21 4.92 5.12 5.12 5.62 5.24 4.9 5.21 5.21 5.01 4.91 5.04 5.26 4.81 4.95 4.98 5.41 4.91 5.12 4.91 5.24 4.91 5.3 4.91 5.44 5.09 4.85 4.92 5.47 5.21 5.24 4.81 5.31 5.11 5.43 5.41 4.82 5.55 5.32 5.21 5.21 5.14 5.32 4.92 5.19 5.23 5.42 5.21 5.13 5.12 5.34 5.12 4.92 5.21 Observations 3 4 5.21 5.3 4.92 4.97 4.92 5.02 5.01 5.2 5.32 5.42 5.24 5.26 5.33 4.94 5.01 5.41 5.25 5.42 5.34 5.21 5.19 5.42 5.31 5.01 5.21 5.41 5.32 5.45 5.56 5.31 5.49 4.81 5.24 5.17 5.32 5.41 5.56 5.03 5.24 4.89 5.31 5.21 5.24 5.55 5.11 5.34 5.11 4.98 4.81 5.21 5.03 5.56 5.33 4.94 5.32 4.99 5.01 5.34 5.44 5 5.2 4.82 5.03 5.19 5.11 5.31 5.55 5.21 5.34 5.32 5.18 5.5 5.01 5.42 5.01 5.32 5.34 5.41 5.21 5.14 5.21 5.22 5.14 5.01 4.91 5.21 5.31 5.21 5.02 5.55 21 22 23 24 25 26 27 28 29 30
Step by Step Solution
There are 3 Steps involved in it
1 Expert Approved Answer
Step: 1 Unlock

Question Has Been Solved by an Expert!
Get step-by-step solutions from verified subject matter experts
Step: 2 Unlock
Step: 3 Unlock