

Question: Based on the sampling done, the control limits for 3-sigma x chart are: Upper Control Limit (UCLx)= inches (round your response to four decimal places).
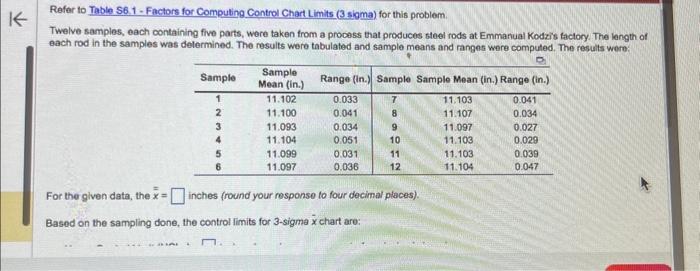
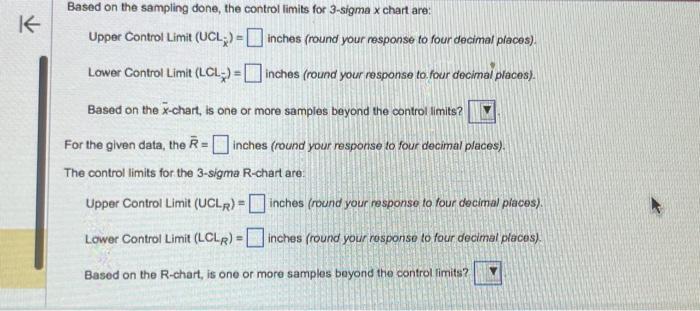
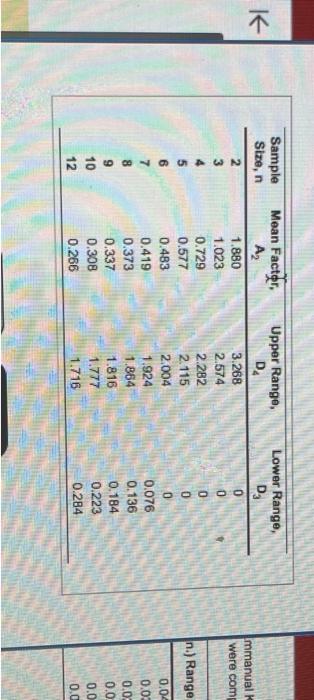
Based on the sampling done, the control limits for 3-sigma x chart are: Upper Control Limit (UCLx)= inches (round your response to four decimal places). Lower Control Limit (LCLx)= inches (round your response to four decimal places). Based on the x-chart, is one or more samples beyond the control limits? For the given data, the R= inches (round your response to four decimal places). The control limits for the 3-sigma R-chart are: Upper Control Limit (UCL LR)= inches (round your response to four decimal places). Lower Control Limit (LCLR)= inches (round your rosponse to four decimal places). Based on the R-chart, is one or more samples beyond the control limits? Twelve samples, each containing five parts, were taken from a process that produces steel rods at Emmanual Kodzis tactory. The length of each rod in the samples was delermined. The results were tabulated and sample means and ranges were computed. The results woro: For the given data, the x= inches (round your response to four decimal places). Based on the sampling done, the control limits for 3-sigme x chart are: mmanual were com
Step by Step Solution
There are 3 Steps involved in it

Get step-by-step solutions from verified subject matter experts