

Question: Based on the Sensitivity Report on the model ( figure 1 ) , which of the following is the savings on a reduction of demand
Based on the Sensitivity Report on the model figure which of the following is the savings on a reduction of demand of units at Jacksonville?
A $
B $
C $
D $
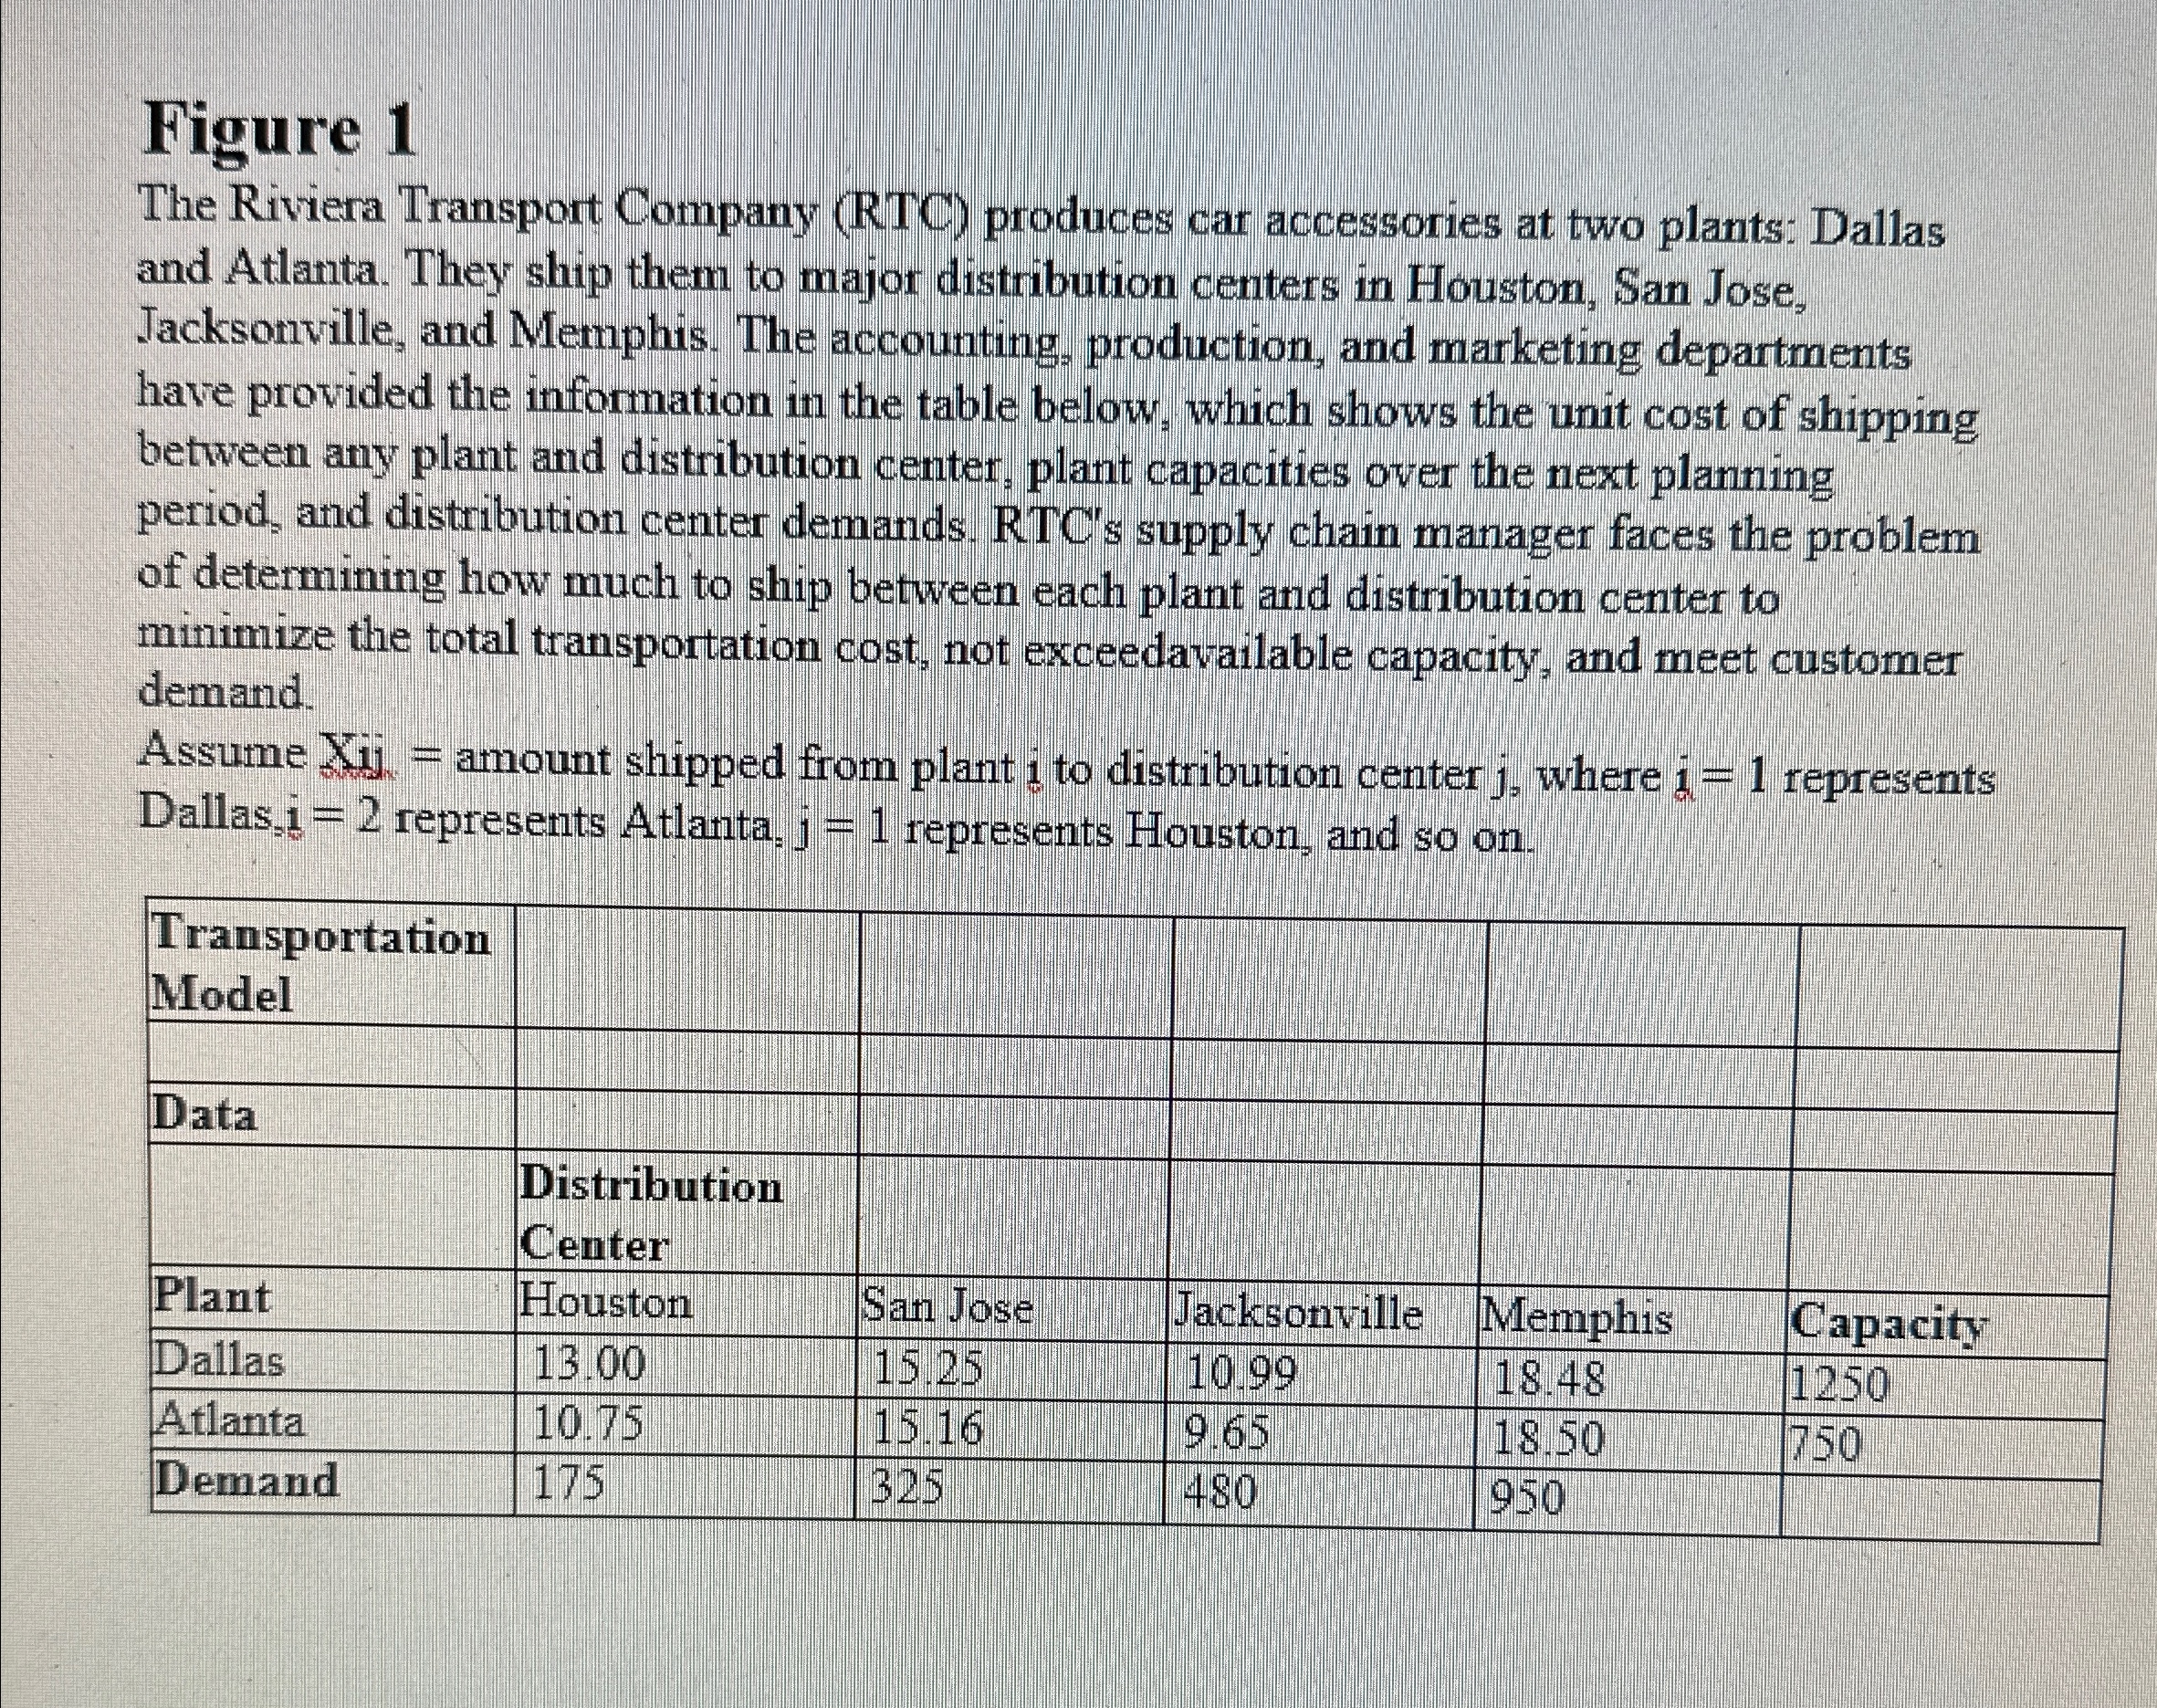
Figure
The Riviera Transport Company RTC produces car accessories at two plants: Dallas and Atlanta. They ship them to major distribution centers in Houston, San Jose, Jacksonville, and Memphis. The accounting, production, and marketing departments have provided the information in the table below, which shows the unit cost of shipping between any plant and distribution center, plant capacities over the next planning period, and distribution center demands. RTCs supply chain manager faces the problem of determining how much to ship between each plant and distribution center to minimize the total transportation cost, not exceedavailable capacity, and meet customer demand.
Assume amount shipped from plant to distribution center where represents Dallas, represents Atlanta, represents Houston, and so on
tabletableTransportationModelDatatableDistributionCenterPlantHouston,San Jose,Jacksonville,Memphis,CapacityDallasAtlantaDemand
Step by Step Solution
There are 3 Steps involved in it
1 Expert Approved Answer
Step: 1 Unlock

Question Has Been Solved by an Expert!
Get step-by-step solutions from verified subject matter experts
Step: 2 Unlock
Step: 3 Unlock