

Question: Based on the shown below ratios, kindly please: indicate whether the information from the ratio is good or bad for the company and why (please
Based on the shown below ratios, kindly please: indicate whether the information from the ratio is good or bad for the company and why (please indicate why is it good or bad). Also make sure to include proper comparison of the year to year data. Minimally, compare the last 10 years. Thank you
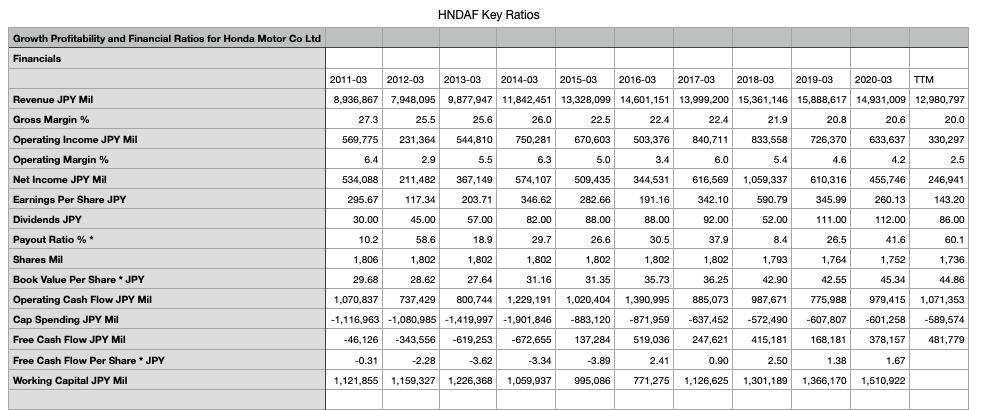
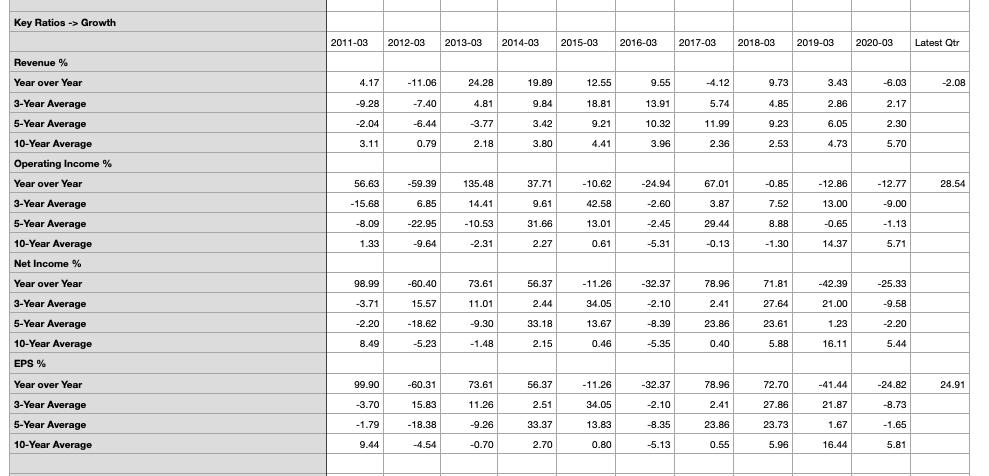
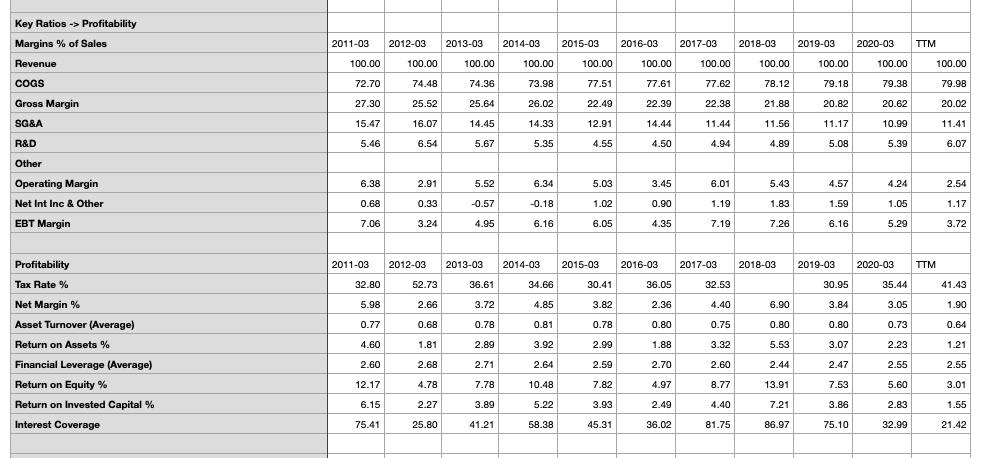
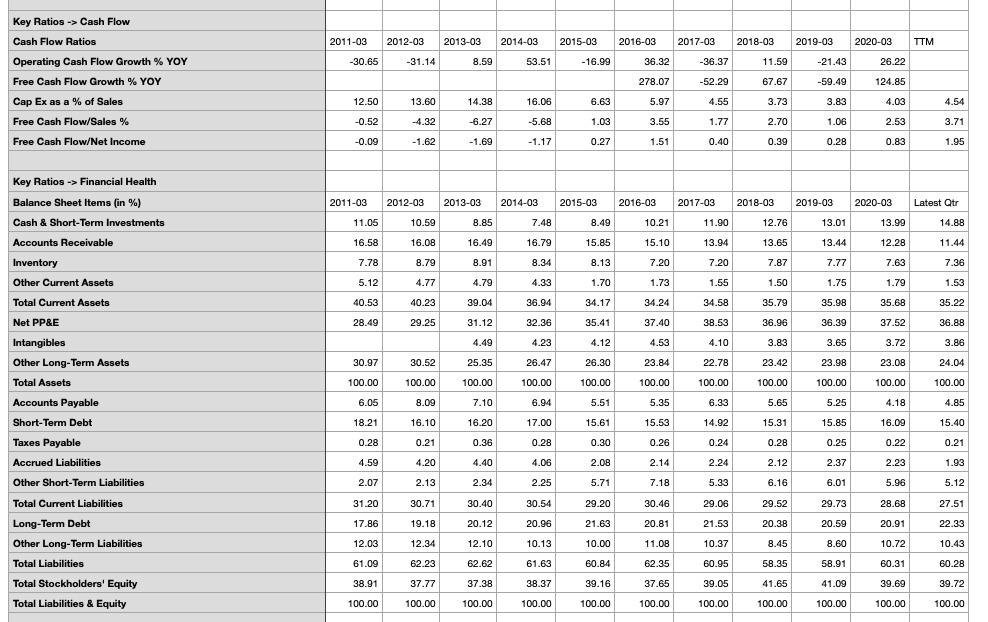
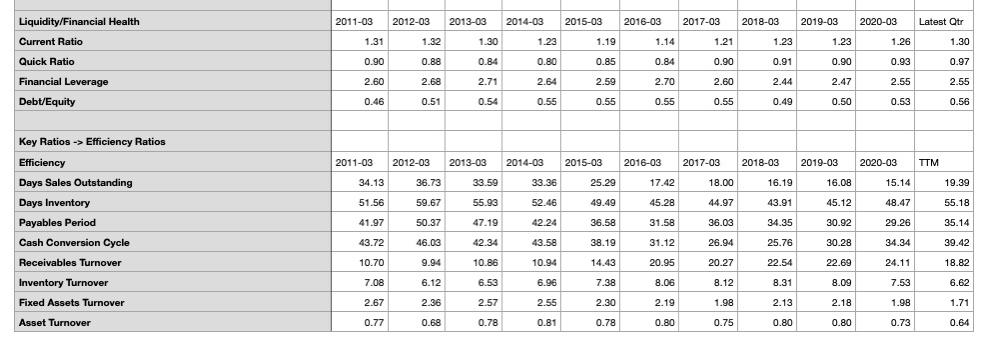
HNDAF Key Ratios Growth Profitability and Financial Ratios for Honda Motor Co Ltd Financials Revenue JPY Mil Gross Margin % Operating Income JPY Mil Operating Margin % Net Income JPY Mil Earnings Per Share JPY Dividends JPY Payout Ratio % Shares Mil Book Value Per Share JPY Operating Cash Flow JPY Mil Cap Spending JPY Mil Free Cash Flow JPY Mil 2011-03 2012-03 2013-03 2014-03 2015-03 2016-03 2017-03 2018-03 2019-03 2020-03 TTM 8,936,867 7,948,095 9,877,947 11,842.451 13,328,099 14,601,151 13,999,200 15,361,146 15,888,617 14,931,009 12,980,797 27.3 25.5 25.6 26.0 22.5 22.4 22.4 21.9 20.8 20.6 20.0 569,775 231,364 544,810 750,281 670,603 503,376 840,711 833,558 726,370 633,637 330,297 6.4 2.9 5.5 6.3 5.0 3.4 6.0 5.4 4.6 4.2 2.5 534,088 211,482 367,149 574,107 509,435 344,531 616,569 1,059,337 610,316 455,746 246,941 295.67 117.34 203.71 346.62 282.66 191.16 342.10 590.79 345.99 260.13 143.20 30.00 45.00 57.00 82.00 88.00 88.00 92.00 52.00 111.00 112.00 86.00 10.2 58.6 18.9 29.7 26.6 30.5 37.9 8.4 26.5 41.6 60.1 1,806 1.802 1,802 1.802 1,802 1,802 1,802 1,793 1,764 1,752 1,736 29.68 28.62 27.64 31.16 31.35 35.73 36.25 42.90 42.55 45.34 44.86 1,070,837 737,429 800,744 1,229,191 1,020,404 1,390,995 885,073 987,671 775,988 979,415 1,071,353 -1,116,963 -1,080,985 -1,419,997 -1,901,846 -883, 120 -871,959 -637,452 -572,490 -607,807 -601,258 -589,574 -46,126 -343,556 -619.253 -672,655 137,284 519,036 247,621 415,181 168,181 378,157 481,779 -0.31 -2.28 -3.62 -3.34 -3.89 2.41 0.90 2.50 1.38 1.67 1.121,855 1.159,327 1,226,368 1,059,937 995,086 771,275 1,126,625 1,301,189 1,366,170 1,510,922 Free Cash Flow Per Share . JPY Working Capital JPY Mil 2011-03 2012-03 2013-03 2014-03 2015-03 2016-03 2017-03 2018-03 2019-03 2020-03 Latest Qtr 19.89 -6.03 -2.08 -11.06 -7.40 12.55 18.81 9.55 13.91 -4.12 5.72 9.84 4.17 -9.28 -2.04 3.11 24.28 4.81 3.77 2.18 -6.44 11.99 3.42 3.80 9.21 4.41 10.32 3.96 2.17 2.30 5.70 0.79 2.36 2.53 4.73 -0.85 28.54 -59.39 6.85 -10.62 42.58 -24.94 2.60 7.52 56.63 -15.68 -8.09 1.33 135.48 14.41 -10.53 -2.31 37.71 9.61 31.66 2.27 67.0 3.87 29.44 -0.13 - 12.86 13.00 -0.6 14.37 -12.77 -9.00 -1.13 5.71 -22.99 -9.64 13.01 0.61 -2.45 -5.31 8.88 -1.30 98.99 60.40 56.37 - 11.26 78.96 15.57 2.44 2.4: -3.71 -220 8.49 73.61 11.01 -9.30 -1.48 -32.37 -2.10 -8.39 5.30 -42.39 21.00 1.23 16.11 -25.33 -9.58 -2.20 5.44 13.67 23.61 33.18 2.15 0.48 0.40 5.88 72.70 24.91 99.90 -3.70 -1.79 -60.31 15.83 -18.38 73.61 11.26 56.37 30. 2.51 36 - 11.26 34.05 13.83 0.80 -32.37 -2.10 -8.35 -5.13 78.96 2.41 23.86 0.55 N8 -41.44 21.87 1.67 16.44 -24.82 -8.73 -1.65 5.81 33.37 2.70 .44 -4.54 -0.70 5.96 2011-03 2012-03 2013-03 2015-03 2016-03 2017-03 2018-03 2020-03 TTM 2014-03 100.00 2019-03 100.00 100.00 100.00 100.00 100.00 100.00 100.00 100.00 100.00 100.00 Key Ratios -> Profitability Margins % of Sales Revenue COGS Gross Margin SG&A 72.70 74.48 74.36 73.98 77.51 77.61 77.62 78.12 79.18 79.38 79.98 27.30 25.52 25.64 26.02 22.49 22.39 22.38 21.88 20.82 20.62 20.02 15.47 16.07 14.45 14.33 12.91 14.44 11.44 11.56 11.17 10.99 11.41 R&D 5.46 6.54 5.67 5.35 4.55 4.50 4.94 4.89 5.08 5.39 6.07 Other 6.38 2.91 5.52 6.34 5.03 3.45 6.01 5.43 4.57 4.24 2.54 Operating Margin Net Int Inc & Other EBT Margin 0.68 0.33 -0.57 -0.18 1.02 0.90 1.19 1.83 1.59 1.05 1.17 7.06 3.24 4.95 6.16 6.05 4.35 7.19 7.26 6.16 5.29 3.72 Profitability 2011-03 2012-03 2014-03 2015-03 2016-03 2017-03 2018-03 2019-03 2020-03 TTM 2013-03 36.61 Tax Rate % 32.80 52.73 34.66 30.41 36.05 32.53 30.95 35.44 41.43 5.98 2.66 3.72 4.85 3.82 2.36 4.40 6.90 3.84 3.05 1.90 0.77 0.68 0.78 0.81 0.78 0.80 0.75 0.80 0.80 0.73 0.64 4.60 1.81 2.89 3.92 2.99 1.88 3.32 5.53 3.07 2.23 1.21 Net Margin % Asset Turnover (Average) Return on Assets % Financial Leverage (Average) Return on Equity % Return on invested Capital % 2.60 2.68 2.71 2.64 2.59 2.70 2.60 2.44 2.47 2.55 2.55 12.17 4.78 7.78 10.48 7.82 4.97 8.77 13.91 7.53 5.60 3.01 6.15 2.27 3.89 5.22 3.93 2.49 4.40 7.21 3.86 2.83 1.55 Interest Coverage 75.41 25.80 41.21 58.38 45.31 36.02 81.75 86.97 75.10 32.99 21.42 2011-03 2012-03 2013-03 2014-03 2015-03 2016-03 2017-03 2018-03 2019-03 2020-03 TTM -30.65 -31.14 8.59 53.51 -16.99 36.32 -36.37 11.59 -21.43 26.22 Key Ratios > Cash Flow Cash Flow Ratios Operating Cash Flow Growth % YOY Free Cash Flow Growth % YOY Cap Ex as a % of Sales Free Cash Flow/Sales % Free Cash Flow/Net Income / 278.07 -52.29 67.67 -59.49 124.85 12.50 13.60 14.38 16.06 6.63 5.97 4.55 3.73 3.83 4.03 4.54 -0.52 -4.32 -6.27 -5.68 1.03 3.55 1.77 2.70 1.06 2.53 3.71 -0.09 -1.62 -1.69 -1.17 0.27 1.51 0.40 0.39 0.28 0.83 1.95 2011-03 2012-03 2013-03 2014-03 2015-03 2016-03 2017-03 2018-03 2019-03 Latest Qtr 2020-03 13.99 11.05 10.59 8.85 7.48 8.49 10.21 11.90 12.76 13.01 14.88 16.58 16.08 16.49 16.79 15.85 15.10 13.94 13.65 13.44 12.28 11.44 8.79 8.91 8.34 8.13 7.20 7.20 7.87 7.77 7.63 7.36 7.78 5.12 4.77 4.79 4.33 1.70 1.73 1.54 1.50 1.75 1.79 1.53 40.53 40.23 39.04 36.94 34.17 34.24 34.58 35.79 35.98 35.68 35.22 28.49 29.25 31.12 32.36 35.41 37.40 38.53 36.96 36.39 37.52 36.88 4.49 4.23 4.12 4.53 4.10 3.83 3.65 3.72 3.86 30.97 30.52 25.35 26.47 26.30 23.84 22.78 23.42 23.98 23.08 24.04 100.00 100.00 100.00 100.00 100.00 100.00 100.00 100.00 100.00 100.00 100.00 Key Ratios -> Financial Health > Balance Sheet Items (in %) Cash & Short-Term Investments Accounts Receivable Inventory Other Current Assets Total Current Assets Net PP&E Intangibles Other Long-Term Assets Total Assets Accounts Payable Short-Term Debt Taxes Payable Accrued Liabilities Other Short-Term Liabilities Total Current Liabilities Long-Term Debt Other Long-Term Liabilities Total Liabilities Total Stockholders' Equity Total Liabilities & Equity 6.05 8.09 7.10 6.94 5.51 5.35 6.33 5.65 5.25 4.18 4.85 18.21 16.10 16.20 17.00 15.61 15.53 14.92 15.31 15.85 16.09 15.40 0.28 0.21 0.36 0.28 0.30 0.26 0.24 0.28 0.25 0.22 0.21 4.59 4.20 4.40 4.06 2.08 2.14 2.24 2.12 2.37 2.23 1.93 2.07 2.13 2.34 2.25 5.71 7.18 5.33 6.16 6.01 5.96 5.12 31.20 30.71 30.40 30.54 29.20 30.46 29.06 29.52 29.73 28.68 27.51 17.86 19.18 20.12 20.96 21.63 20.81 21.53 20.38 20.59 20.91 22.33 12.03 12.34 12.10 10.13 10.00 11.08 10.37 8.45 8.60 10.72 10.43 61.09 62.23 62.62 61.63 60.84 62.35 60.95 58.35 58.91 60.31 60.28 38.91 37.77 37.38 38.37 39.16 37.65 39.05 41.65 41.09 39.69 39.72 100.00 100.00 100.00 100.00 100.00 100.00 100.00 100.00 100.00 100.00 100.00 2011-03 2012-03 2013-03 2014-03 2015-03 2016-03 2017-03 2018-03 2019-03 2020-03 Latest Qtr Liquidity/Financial Health Current Ratio Quick Ratio 1.31 1.32 1.30 1.23 1.19 1.14 1.21 1.23 1.23 1.26 1.30 0.90 0.84 0.80 0.85 0.84 0.90 0.91 0.90 0.93 0.97 0.88 2.68 Financial Leverage 2.60 2.71 2.64 2.59 2.70 2.60 2.44 2.47 2.55 2.55 Debt/Equity 0.46 0.51 0.54 0.55 0.55 0.55 0.55 0.49 0.50 0.53 0.56 2011-03 2012-03 2013-03 2014-03 2015-03 2016-03 2017-03 2018-03 2019-03 2020-03 TTM 34.13 36.73 33.59 33.36 25.29 17.42 18.00 16.19 16.08 15.14 19.39 51.56 59.67 55.93 52.46 49.49 45.28 44.97 43.91 45.12 48.47 55.18 Key Ratios > Efficiency Ratios Efficiency Days Sales Outstanding Days Inventory Payables Period Cash Conversion Cycle Receivables Turnover Inventory Turnover 41.97 50.37 47.19 42.24 36.58 31.58 36.03 34.35 30.92 29.26 35.14 43.72 46.03 42.34 43.58 38.19 31.12 26.94 25.76 30.28 34.34 39.42 10.70 9.94 10.86 10.94 14.43 20.95 20.27 22.54 22.69 24.11 18.82 7.08 6.12 6.53 6.96 7.38 8.06 8.12 8.31 8.09 7.53 6.62 Fixed Assets Turnover 2.67 2.36 2.57 2.55 2.30 2.19 1.98 2.13 2.18 1.98 1.71 Asset Turnover 0.77 0.68 0.78 0.81 0.78 0.80 0.75 0.80 0.80 0.73 0.64 HNDAF Key Ratios Growth Profitability and Financial Ratios for Honda Motor Co Ltd Financials Revenue JPY Mil Gross Margin % Operating Income JPY Mil Operating Margin % Net Income JPY Mil Earnings Per Share JPY Dividends JPY Payout Ratio % Shares Mil Book Value Per Share JPY Operating Cash Flow JPY Mil Cap Spending JPY Mil Free Cash Flow JPY Mil 2011-03 2012-03 2013-03 2014-03 2015-03 2016-03 2017-03 2018-03 2019-03 2020-03 TTM 8,936,867 7,948,095 9,877,947 11,842.451 13,328,099 14,601,151 13,999,200 15,361,146 15,888,617 14,931,009 12,980,797 27.3 25.5 25.6 26.0 22.5 22.4 22.4 21.9 20.8 20.6 20.0 569,775 231,364 544,810 750,281 670,603 503,376 840,711 833,558 726,370 633,637 330,297 6.4 2.9 5.5 6.3 5.0 3.4 6.0 5.4 4.6 4.2 2.5 534,088 211,482 367,149 574,107 509,435 344,531 616,569 1,059,337 610,316 455,746 246,941 295.67 117.34 203.71 346.62 282.66 191.16 342.10 590.79 345.99 260.13 143.20 30.00 45.00 57.00 82.00 88.00 88.00 92.00 52.00 111.00 112.00 86.00 10.2 58.6 18.9 29.7 26.6 30.5 37.9 8.4 26.5 41.6 60.1 1,806 1.802 1,802 1.802 1,802 1,802 1,802 1,793 1,764 1,752 1,736 29.68 28.62 27.64 31.16 31.35 35.73 36.25 42.90 42.55 45.34 44.86 1,070,837 737,429 800,744 1,229,191 1,020,404 1,390,995 885,073 987,671 775,988 979,415 1,071,353 -1,116,963 -1,080,985 -1,419,997 -1,901,846 -883, 120 -871,959 -637,452 -572,490 -607,807 -601,258 -589,574 -46,126 -343,556 -619.253 -672,655 137,284 519,036 247,621 415,181 168,181 378,157 481,779 -0.31 -2.28 -3.62 -3.34 -3.89 2.41 0.90 2.50 1.38 1.67 1.121,855 1.159,327 1,226,368 1,059,937 995,086 771,275 1,126,625 1,301,189 1,366,170 1,510,922 Free Cash Flow Per Share . JPY Working Capital JPY Mil 2011-03 2012-03 2013-03 2014-03 2015-03 2016-03 2017-03 2018-03 2019-03 2020-03 Latest Qtr 19.89 -6.03 -2.08 -11.06 -7.40 12.55 18.81 9.55 13.91 -4.12 5.72 9.84 4.17 -9.28 -2.04 3.11 24.28 4.81 3.77 2.18 -6.44 11.99 3.42 3.80 9.21 4.41 10.32 3.96 2.17 2.30 5.70 0.79 2.36 2.53 4.73 -0.85 28.54 -59.39 6.85 -10.62 42.58 -24.94 2.60 7.52 56.63 -15.68 -8.09 1.33 135.48 14.41 -10.53 -2.31 37.71 9.61 31.66 2.27 67.0 3.87 29.44 -0.13 - 12.86 13.00 -0.6 14.37 -12.77 -9.00 -1.13 5.71 -22.99 -9.64 13.01 0.61 -2.45 -5.31 8.88 -1.30 98.99 60.40 56.37 - 11.26 78.96 15.57 2.44 2.4: -3.71 -220 8.49 73.61 11.01 -9.30 -1.48 -32.37 -2.10 -8.39 5.30 -42.39 21.00 1.23 16.11 -25.33 -9.58 -2.20 5.44 13.67 23.61 33.18 2.15 0.48 0.40 5.88 72.70 24.91 99.90 -3.70 -1.79 -60.31 15.83 -18.38 73.61 11.26 56.37 30. 2.51 36 - 11.26 34.05 13.83 0.80 -32.37 -2.10 -8.35 -5.13 78.96 2.41 23.86 0.55 N8 -41.44 21.87 1.67 16.44 -24.82 -8.73 -1.65 5.81 33.37 2.70 .44 -4.54 -0.70 5.96 2011-03 2012-03 2013-03 2015-03 2016-03 2017-03 2018-03 2020-03 TTM 2014-03 100.00 2019-03 100.00 100.00 100.00 100.00 100.00 100.00 100.00 100.00 100.00 100.00 Key Ratios -> Profitability Margins % of Sales Revenue COGS Gross Margin SG&A 72.70 74.48 74.36 73.98 77.51 77.61 77.62 78.12 79.18 79.38 79.98 27.30 25.52 25.64 26.02 22.49 22.39 22.38 21.88 20.82 20.62 20.02 15.47 16.07 14.45 14.33 12.91 14.44 11.44 11.56 11.17 10.99 11.41 R&D 5.46 6.54 5.67 5.35 4.55 4.50 4.94 4.89 5.08 5.39 6.07 Other 6.38 2.91 5.52 6.34 5.03 3.45 6.01 5.43 4.57 4.24 2.54 Operating Margin Net Int Inc & Other EBT Margin 0.68 0.33 -0.57 -0.18 1.02 0.90 1.19 1.83 1.59 1.05 1.17 7.06 3.24 4.95 6.16 6.05 4.35 7.19 7.26 6.16 5.29 3.72 Profitability 2011-03 2012-03 2014-03 2015-03 2016-03 2017-03 2018-03 2019-03 2020-03 TTM 2013-03 36.61 Tax Rate % 32.80 52.73 34.66 30.41 36.05 32.53 30.95 35.44 41.43 5.98 2.66 3.72 4.85 3.82 2.36 4.40 6.90 3.84 3.05 1.90 0.77 0.68 0.78 0.81 0.78 0.80 0.75 0.80 0.80 0.73 0.64 4.60 1.81 2.89 3.92 2.99 1.88 3.32 5.53 3.07 2.23 1.21 Net Margin % Asset Turnover (Average) Return on Assets % Financial Leverage (Average) Return on Equity % Return on invested Capital % 2.60 2.68 2.71 2.64 2.59 2.70 2.60 2.44 2.47 2.55 2.55 12.17 4.78 7.78 10.48 7.82 4.97 8.77 13.91 7.53 5.60 3.01 6.15 2.27 3.89 5.22 3.93 2.49 4.40 7.21 3.86 2.83 1.55 Interest Coverage 75.41 25.80 41.21 58.38 45.31 36.02 81.75 86.97 75.10 32.99 21.42 2011-03 2012-03 2013-03 2014-03 2015-03 2016-03 2017-03 2018-03 2019-03 2020-03 TTM -30.65 -31.14 8.59 53.51 -16.99 36.32 -36.37 11.59 -21.43 26.22 Key Ratios > Cash Flow Cash Flow Ratios Operating Cash Flow Growth % YOY Free Cash Flow Growth % YOY Cap Ex as a % of Sales Free Cash Flow/Sales % Free Cash Flow/Net Income / 278.07 -52.29 67.67 -59.49 124.85 12.50 13.60 14.38 16.06 6.63 5.97 4.55 3.73 3.83 4.03 4.54 -0.52 -4.32 -6.27 -5.68 1.03 3.55 1.77 2.70 1.06 2.53 3.71 -0.09 -1.62 -1.69 -1.17 0.27 1.51 0.40 0.39 0.28 0.83 1.95 2011-03 2012-03 2013-03 2014-03 2015-03 2016-03 2017-03 2018-03 2019-03 Latest Qtr 2020-03 13.99 11.05 10.59 8.85 7.48 8.49 10.21 11.90 12.76 13.01 14.88 16.58 16.08 16.49 16.79 15.85 15.10 13.94 13.65 13.44 12.28 11.44 8.79 8.91 8.34 8.13 7.20 7.20 7.87 7.77 7.63 7.36 7.78 5.12 4.77 4.79 4.33 1.70 1.73 1.54 1.50 1.75 1.79 1.53 40.53 40.23 39.04 36.94 34.17 34.24 34.58 35.79 35.98 35.68 35.22 28.49 29.25 31.12 32.36 35.41 37.40 38.53 36.96 36.39 37.52 36.88 4.49 4.23 4.12 4.53 4.10 3.83 3.65 3.72 3.86 30.97 30.52 25.35 26.47 26.30 23.84 22.78 23.42 23.98 23.08 24.04 100.00 100.00 100.00 100.00 100.00 100.00 100.00 100.00 100.00 100.00 100.00 Key Ratios -> Financial Health > Balance Sheet Items (in %) Cash & Short-Term Investments Accounts Receivable Inventory Other Current Assets Total Current Assets Net PP&E Intangibles Other Long-Term Assets Total Assets Accounts Payable Short-Term Debt Taxes Payable Accrued Liabilities Other Short-Term Liabilities Total Current Liabilities Long-Term Debt Other Long-Term Liabilities Total Liabilities Total Stockholders' Equity Total Liabilities & Equity 6.05 8.09 7.10 6.94 5.51 5.35 6.33 5.65 5.25 4.18 4.85 18.21 16.10 16.20 17.00 15.61 15.53 14.92 15.31 15.85 16.09 15.40 0.28 0.21 0.36 0.28 0.30 0.26 0.24 0.28 0.25 0.22 0.21 4.59 4.20 4.40 4.06 2.08 2.14 2.24 2.12 2.37 2.23 1.93 2.07 2.13 2.34 2.25 5.71 7.18 5.33 6.16 6.01 5.96 5.12 31.20 30.71 30.40 30.54 29.20 30.46 29.06 29.52 29.73 28.68 27.51 17.86 19.18 20.12 20.96 21.63 20.81 21.53 20.38 20.59 20.91 22.33 12.03 12.34 12.10 10.13 10.00 11.08 10.37 8.45 8.60 10.72 10.43 61.09 62.23 62.62 61.63 60.84 62.35 60.95 58.35 58.91 60.31 60.28 38.91 37.77 37.38 38.37 39.16 37.65 39.05 41.65 41.09 39.69 39.72 100.00 100.00 100.00 100.00 100.00 100.00 100.00 100.00 100.00 100.00 100.00 2011-03 2012-03 2013-03 2014-03 2015-03 2016-03 2017-03 2018-03 2019-03 2020-03 Latest Qtr Liquidity/Financial Health Current Ratio Quick Ratio 1.31 1.32 1.30 1.23 1.19 1.14 1.21 1.23 1.23 1.26 1.30 0.90 0.84 0.80 0.85 0.84 0.90 0.91 0.90 0.93 0.97 0.88 2.68 Financial Leverage 2.60 2.71 2.64 2.59 2.70 2.60 2.44 2.47 2.55 2.55 Debt/Equity 0.46 0.51 0.54 0.55 0.55 0.55 0.55 0.49 0.50 0.53 0.56 2011-03 2012-03 2013-03 2014-03 2015-03 2016-03 2017-03 2018-03 2019-03 2020-03 TTM 34.13 36.73 33.59 33.36 25.29 17.42 18.00 16.19 16.08 15.14 19.39 51.56 59.67 55.93 52.46 49.49 45.28 44.97 43.91 45.12 48.47 55.18 Key Ratios > Efficiency Ratios Efficiency Days Sales Outstanding Days Inventory Payables Period Cash Conversion Cycle Receivables Turnover Inventory Turnover 41.97 50.37 47.19 42.24 36.58 31.58 36.03 34.35 30.92 29.26 35.14 43.72 46.03 42.34 43.58 38.19 31.12 26.94 25.76 30.28 34.34 39.42 10.70 9.94 10.86 10.94 14.43 20.95 20.27 22.54 22.69 24.11 18.82 7.08 6.12 6.53 6.96 7.38 8.06 8.12 8.31 8.09 7.53 6.62 Fixed Assets Turnover 2.67 2.36 2.57 2.55 2.30 2.19 1.98 2.13 2.18 1.98 1.71 Asset Turnover 0.77 0.68 0.78 0.81 0.78 0.80 0.75 0.80 0.80 0.73 0.64
Step by Step Solution
There are 3 Steps involved in it

Get step-by-step solutions from verified subject matter experts