

Question: Based on the survey results shown below some analysts argue that vaccinated people do not have confidence in the Covid-19 vaccines because they are more
Based on the survey results shown below some analysts argue that vaccinated people do not have confidence in the Covid-19 vaccines because they are more likely to worry about getting sick from Covid-19. Do the survey results support this claim? Using the concepts learned in class, explain why we should be wary of this conclusion?
Note: The figure shows the evolution of labor income (panels A-B) between 1982- 1993 for groups that were affected differently by the 1987 reform. The figure is based on a balanced panel of individuals who are observed throughout the period. The vertical line at 1986 denotes the last pre-reform year (as the reform was passed in parliament during 1986 and changed tax rates starting from 1987), and income levels in 1986 are normalized to 100 in all groups. The treatment-control definition is based on the reform-induced tax variation for the different groups, with treatments (controls) being an aggregation of groups who experience an increase (decrease) in the marginal net-of-tax rate due to the reform. Panel B splits the treatment group for labor income into those who experience the largest net-of-tax rate increases and those who experience smaller net-of-tax rate increases
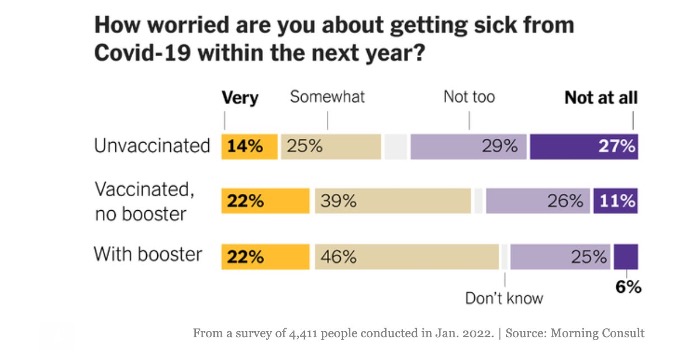
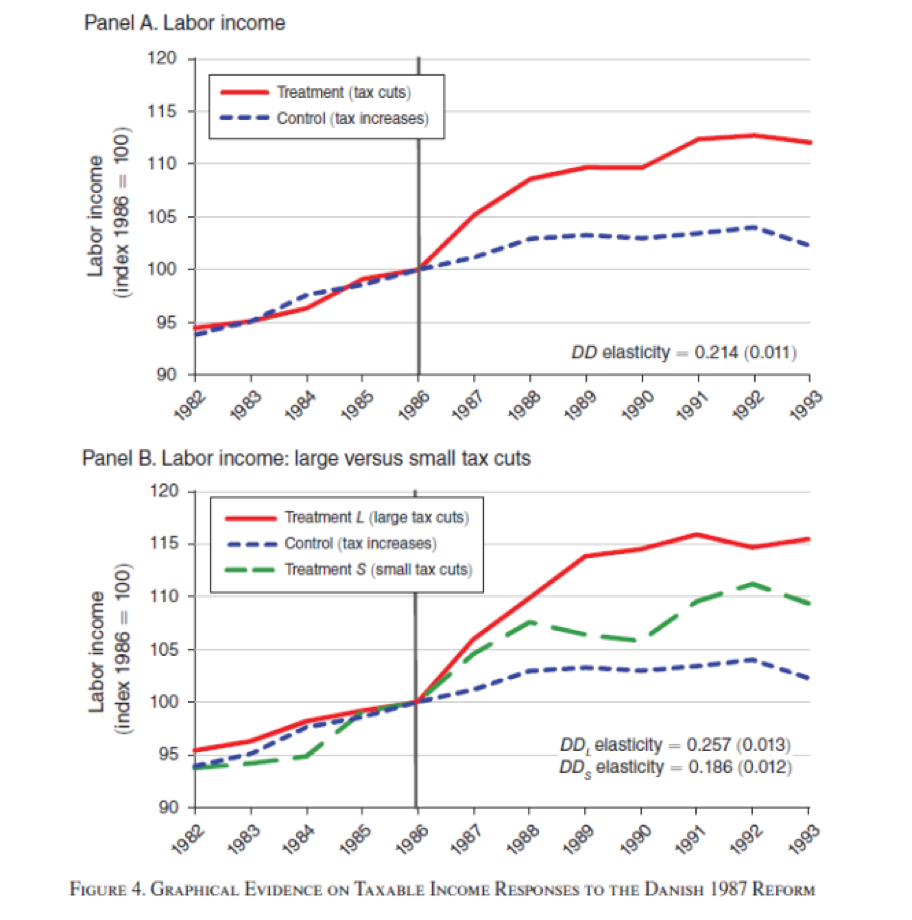
How worried are you about getting sick from Covid-19 within the next year? Very Somewhat Not too Not at all Unvaccinated 14% 25% 29% 27% Vaccinated, 22% 39% 26% 11% no booster With booster 22% 46% 25% 6% Don't know From a survey of 4,411 people conducted in Jan. 2022. | Source: Morning ConsultPanel A. Labor income 120 - Treatment (tax cuts) 115 - -- Control (tax increases) 110 (index 1986 = 100) Labor income 105 100 95 90 DD elasticity = 0.214 (0.011) 1982 1983 1984 1985 1986 1987 1988 89 1990 1991 1992 1993 Panel B. Labor income: large versus small tax cuts 120 Treatment L (large tax cuts) 115 - - Control (tax increases) Treatment S (small tax cuts) 110 (index 1986 = 100 Labor income 105 100 95 DD, elasticity = 0.257 (0.013) DD, elasticity = 0.186 (0.012) 90 1982 1983 1984 19 1986 1987 1988 1989 1990 19 1992 1993 FIGURE 4. GRAPHICAL EVIDENCE ON TAXABLE INCOME RESPONSES TO THE DANISH 1987 REFORM
Step by Step Solution
There are 3 Steps involved in it

Get step-by-step solutions from verified subject matter experts