

Question: Based on the table and graph above, what is the Maximum Sharpe Ratio that you can achieve? Sharpe Ratio Minimum Variance Portfolio Optimal Risky Portfolio
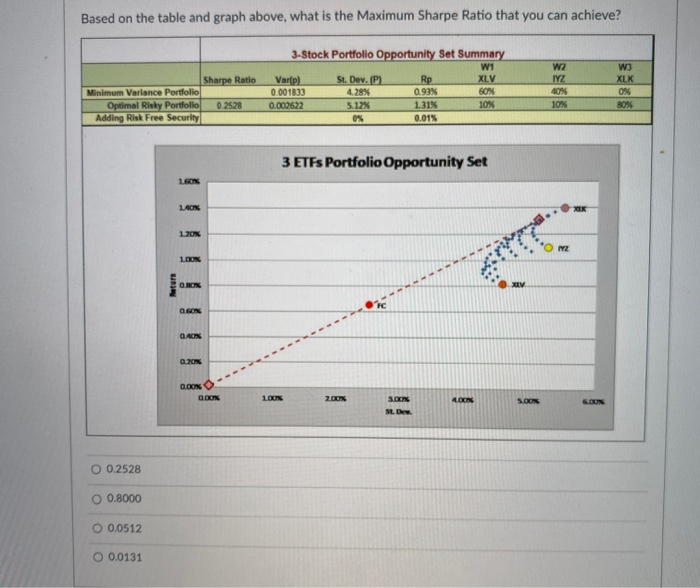
Based on the table and graph above, what is the Maximum Sharpe Ratio that you can achieve? Sharpe Ratio Minimum Variance Portfolio Optimal Risky Portfolio 02528 Adding Risk Free Security 3-Stock Portfolio Opportunity Set Summary W1 Vartp) St. Dev. P2 Rp XLV 0.001833 4.28% 0.93% 60% 0.002622 5.19% 131% 10% 0% 0.01% W2 TYZ 40% 10% W3 XLK 0% BOX 3 ETFs Portfolio Opportunity Set LAON 20K ON 12 LOON Meter CRON AX 0.70% D.DON 100% 2.00% 4DN SOON 6.BON SON SED O 0.2528 O 0.8000 O 0.0512 O 0.0131
Step by Step Solution
There are 3 Steps involved in it
1 Expert Approved Answer
Step: 1 Unlock

Question Has Been Solved by an Expert!
Get step-by-step solutions from verified subject matter experts
Step: 2 Unlock
Step: 3 Unlock