

Question: Based on the table below, the Average Collection Period (365 day year) is: Income Statement Balance Sheet Sales $20,000,000 Cost of Goods Sold 8,000,000 12,000,000
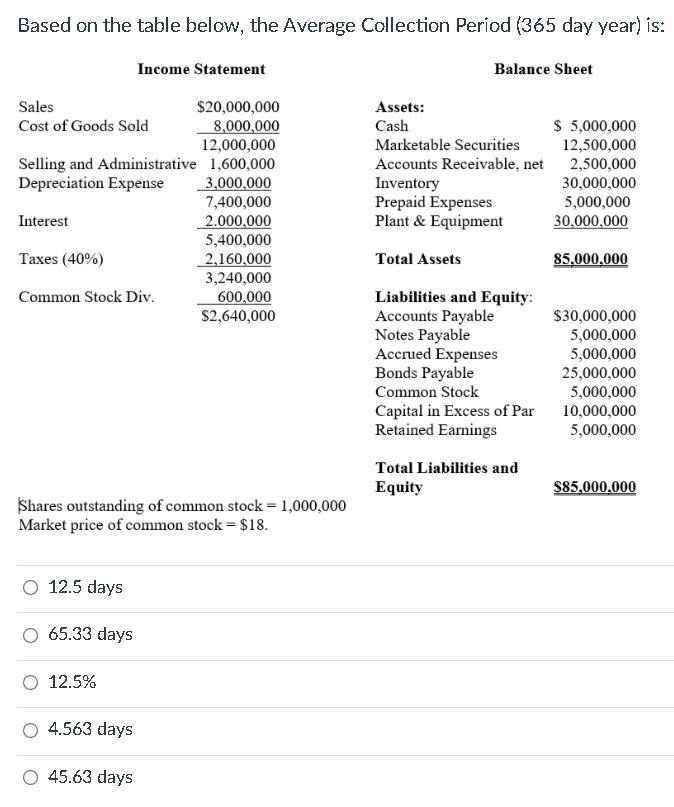
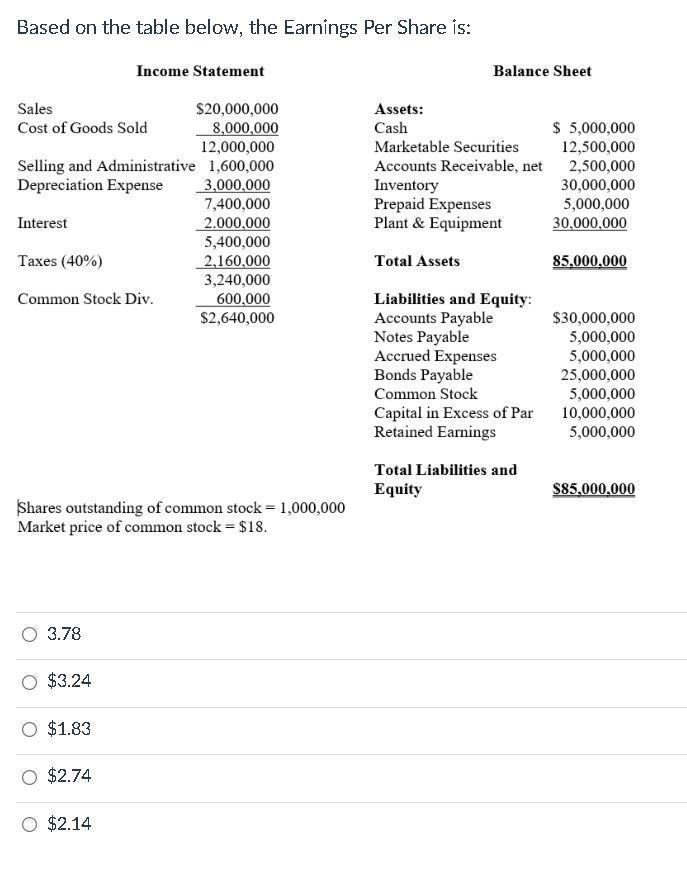
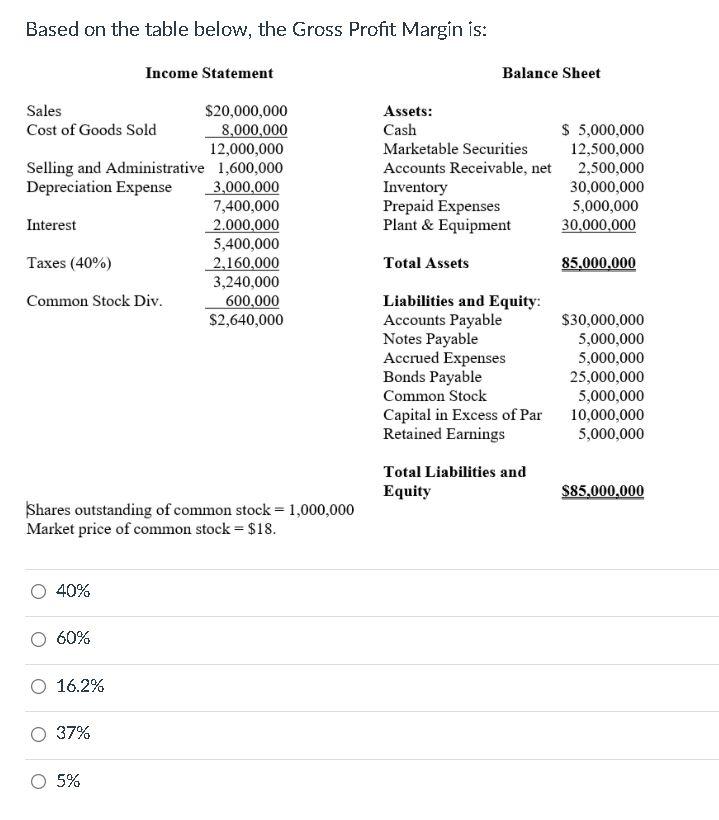
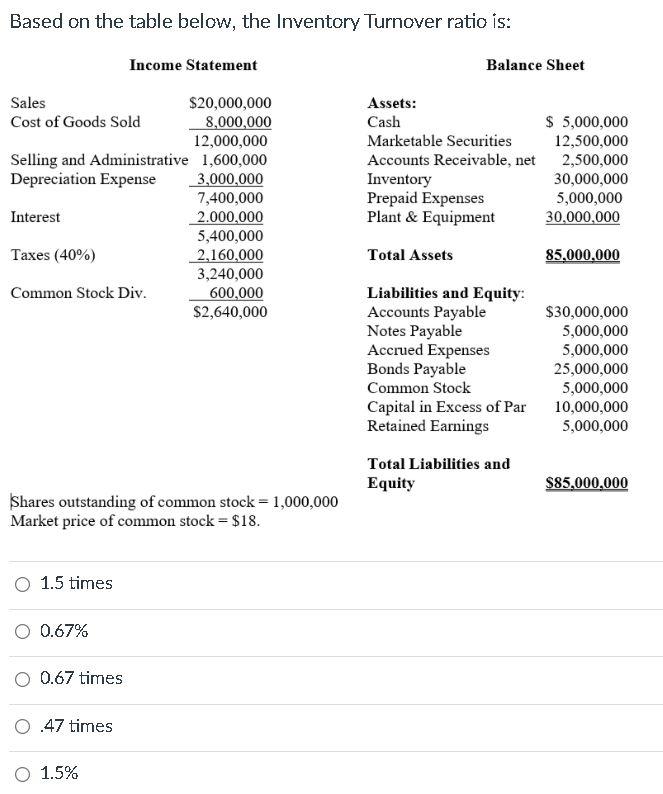
Based on the table below, the Average Collection Period (365 day year) is: Income Statement Balance Sheet Sales $20,000,000 Cost of Goods Sold 8,000,000 12,000,000 Selling and Administrative 1,600,000 Depreciation Expense 3,000,000 7,400,000 Interest 2.000,000 5,400,000 Taxes (40%) 2,160,000 3,240,000 Common Stock Div. 600,000 $2,640,000 Assets: Cash Marketable Securities Accounts Receivable, net Inventory Prepaid Expenses Plant & Equipment $ 5,000,000 12,500,000 2,500,000 30,000,000 5,000,000 30,000,000 Total Assets 85,000,000 Liabilities and Equity: Accounts Payable Notes Payable Accrued Expenses Bonds Payable Common Stock Capital in Excess of Par Retained Earnings $30,000,000 5,000,000 5,000,000 25,000,000 5,000,000 10,000,000 5,000,000 Total Liabilities and Equity $85,000,000 Shares outstanding of common stock = 1,000,000 Market price of common stock = $18. O 12.5 days 65.33 days 12.5% 4.563 days O 45.63 days Based on the table below, the Earnings Per Share Income Statement Balance Sheet Sales $20,000,000 Cost of Goods Sold 8,000,000 12,000,000 Selling and Administrative 1,600,000 Depreciation Expense 3,000,000 7,400,000 Interest 2.000,000 5,400,000 Taxes (40%) 2,160,000 3,240,000 Common Stock Div. 600,000 $2,640,000 Assets: Cash Marketable Securities Accounts Receivable, net Inventory Prepaid Expenses Plant & Equipment $ 5,000,000 12,500,000 2,500,000 30,000,000 5,000,000 30,000,000 Total Assets 85.000.000 Liabilities and Equity: Accounts Payable Notes Payable Accrued Expenses Bonds Payable Common Stock Capital in Excess of Par Retained Earnings Total Liabilities and Equity $30,000,000 5,000,000 5,000,000 25,000,000 5,000,000 10,000,000 5,000,000 $85,000,000 Shares outstanding of common stock = 1,000,000 Market price of common stock = $18. 0 3.78 $3.24 O $1.83 O $2.74 $2.14 Based on the table below, the Gross Profit Margin is: Income Statement Balance Sheet Sales $20,000,000 Cost of Goods Sold 8,000,000 12,000,000 Selling and Administrative 1,600,000 Depreciation Expense 3,000,000 7,400,000 Interest 2.000.000 5,400,000 Taxes (40%) 2,160,000 3,240,000 Common Stock Div. 600,000 $2,640,000 Assets: Cash Marketable Securities Accounts Receivable, net Inventory Prepaid Expenses Plant & Equipment $ 5,000,000 12,500,000 2,500,000 30,000,000 5,000,000 30,000,000 Total Assets 85,000,000 Liabilities and Equity: Accounts Payable Notes Payable Accrued Expenses Bonds Payable Common Stock Capital in Excess of Par Retained Earnings $30,000,000 5,000,000 5,000,000 25,000,000 5,000,000 10,000,000 5,000,000 Total Liabilities and Equity $85,000,000 Shares outstanding of common stock = 1,000,000 Market price of common stock = $18. 0 40% 60% O 16.2% 37% O 5% Based on the table below, the Inventory Turnover ratio is: Income Statement Balance Sheet Sales $20,000,000 Cost of Goods Sold 8,000,000 12,000,000 Selling and Administrative 1,600,000 Depreciation Expense 3,000,000 7,400,000 Interest 2.000.000 5,400,000 Taxes (40%) 2,160,000 3,240,000 Common Stock Div. 600,000 $2,640,000 Assets: Cash Marketable Securities Accounts Receivable, net Inventory Prepaid Expenses Plant & Equipment $ 5,000,000 12,500,000 2,500,000 30,000,000 5,000,000 30,000,000 Total Assets 85,000,000 Liabilities and Equity: Accounts Payable Notes Payable Accrued Expenses Bonds Payable Common Stock Capital in Excess of Par Retained Earnings $30,000,000 5,000,000 5,000,000 25,000,000 5,000,000 10,000,000 5,000,000 Total Liabilities and Equity $85,000,000 Shares outstanding of common stock = 1,000,000 Market price of common stock = $18. O 1.5 times O 0.67% O 0.67 times 0.47 times O 1.5%
Step by Step Solution
There are 3 Steps involved in it

Get step-by-step solutions from verified subject matter experts