

Question: Based on the table below, the Total Debt to Total Asset ratio is: Income Statement Balance Sheet Sales $20,000,000 Assets: Cost of Goods Sold
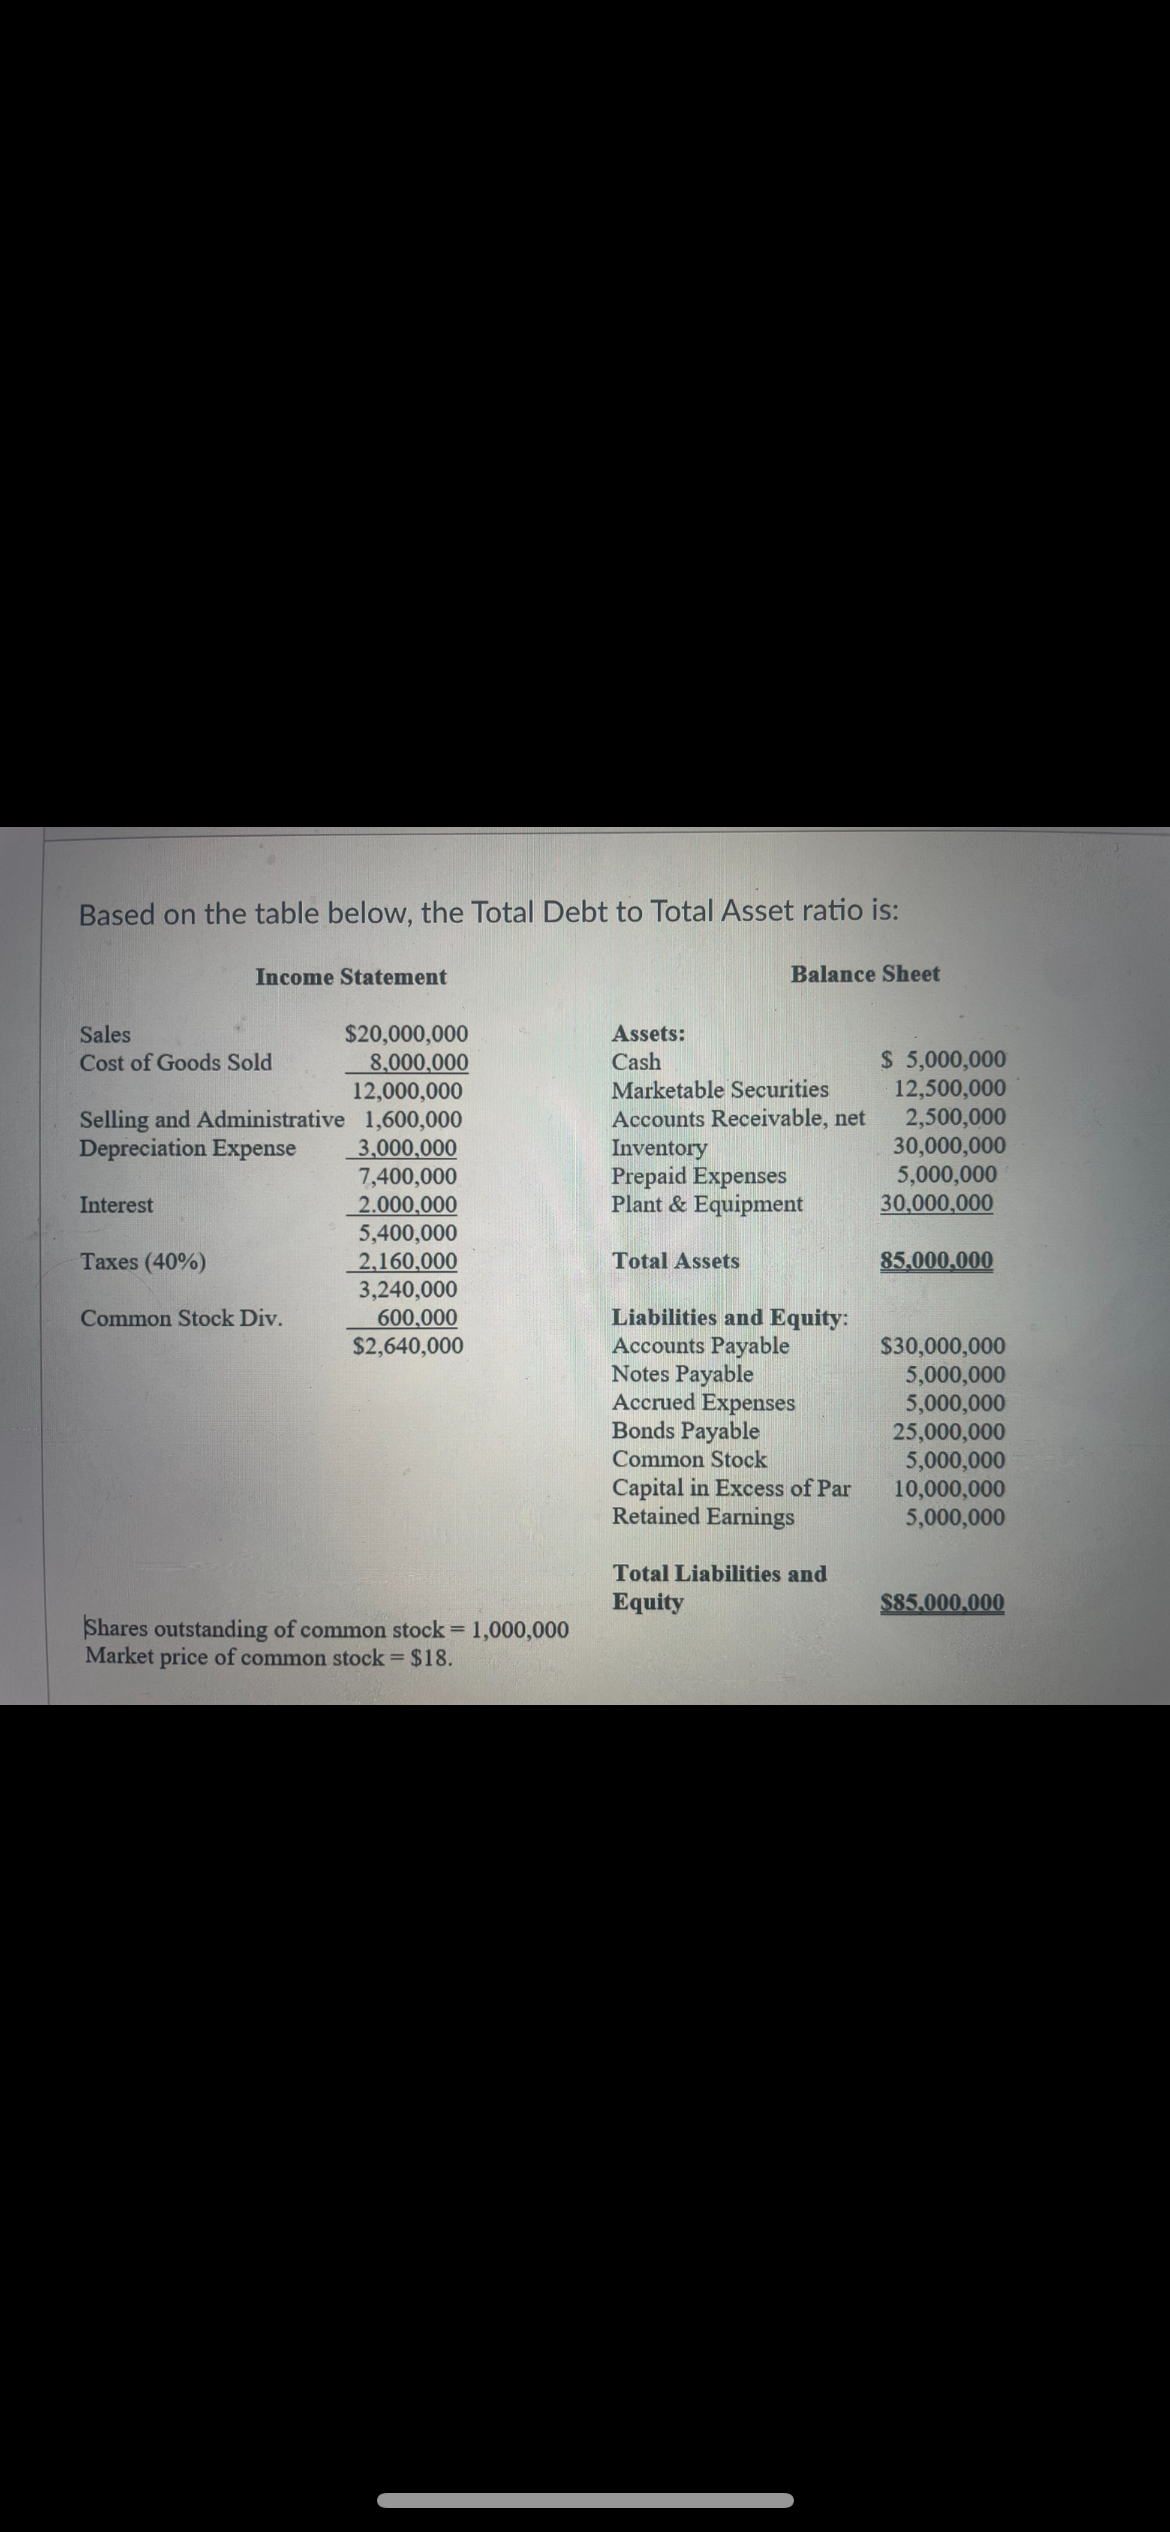
Based on the table below, the Total Debt to Total Asset ratio is: Income Statement Balance Sheet Sales $20,000,000 Assets: Cost of Goods Sold 8,000,000 Cash $ 5,000,000 12,000,000 Marketable Securities 12,500,000 Selling and Administrative 1,600,000 Accounts Receivable, net 2,500,000 Depreciation Expense 3,000,000 Inventory 30,000,000 7,400,000 Prepaid Expenses 5,000,000 Interest 2.000,000 Plant & Equipment 30,000,000 5,400,000 Taxes (40%) 2,160,000 Total Assets 85,000,000 3,240,000 Common Stock Div. 600,000 Liabilities and Equity: $2,640,000 Accounts Payable $30,000,000 Notes Payable 5,000,000 Accrued Expenses 5,000,000 Bonds Payable 25,000,000 Common Stock 5,000,000 Capital in Excess of Par 10,000,000 Retained Earnings 5,000,000 Total Liabilities and Equity $85,000,000 Shares outstanding of common stock = 1,000,000 Market price of common stock = $18.
Step by Step Solution
There are 3 Steps involved in it

Get step-by-step solutions from verified subject matter experts