

Question: Based on the table below, which is a PPF table depicting maximum output capabilities for each good, determine who has comparative advantage in pumpkins. You
Based on the table below, which is a PPF table depicting maximum output capabilities for each good, determine who has comparative advantage in pumpkins. You must show work to receive credit. (6 pts.)
| ? | Apples | Pumpkins |
| Jericho | 200 | 300 |
| Syosset | 100 | 200 |
a) Based on your results to the previous question (table above), which would be the world price of apples, $3 or $6? Explain.
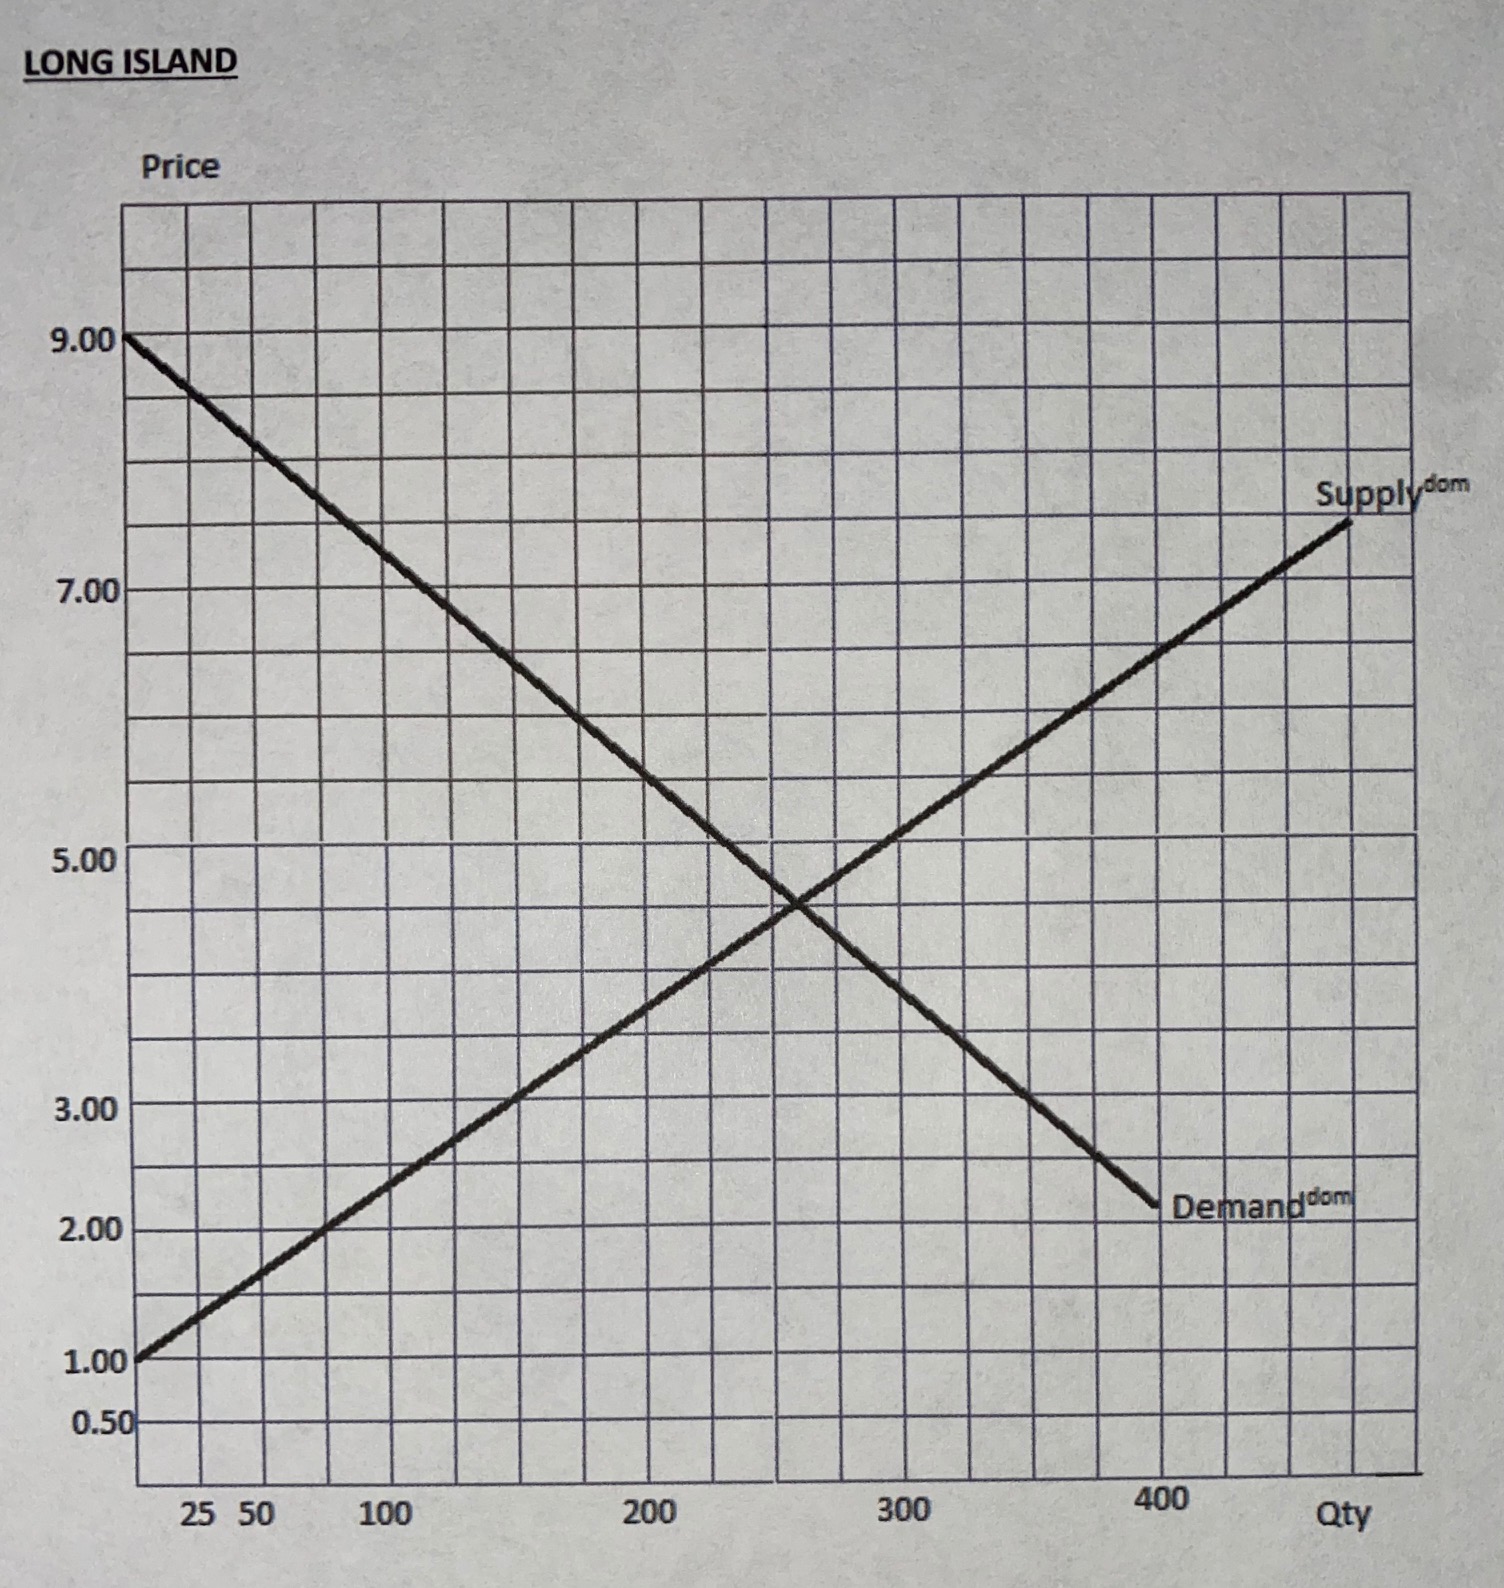
b) Using the world price selected in b, determine the Qs(domestic) and Qd(domestic)
c) Would a quota help or hurt domestic producers of apples? Explain

LONG ISLAND Price 9.00 Supplydom 7.00 5.00 3.00 2.00 Demanddom 1.00 0.50 25 50 100 200 300 400 Qty
Step by Step Solution
There are 3 Steps involved in it
1 Expert Approved Answer
Step: 1 Unlock

Question Has Been Solved by an Expert!
Get step-by-step solutions from verified subject matter experts
Step: 2 Unlock
Step: 3 Unlock