

Question: Based on the table provided, answer the following questions: a) Compute the U.S. dollar-yen exchange rate Es[Y and the U.S. dollar-Canadian dollar exchange rate Esjcs
Based on the table provided, answer the following questions:
a) Compute the U.S. dollar-yen exchange rate Es[Y and the U.S. dollar-Canadian dollar exchange rate Esjcs on June 25, 2010 and June 25, 2009.
b) What happened to the value of the U.S. dollar relative to the Japanese yen and Canadian dollar between June 25, 2009, and June 25, 2010? Compute the percentage change in the value of the U.S. dollar relative to each currency using the U.S. ollar-freign currency exchange rates you computed in (a).
c) Using information in the table for June 25, 2010, compute the Danish krone-Canadian dollar exchange rate EkronelCS.
d) Visit the website of the board of Governors of the Federal Reserve System at http://www. federalreserve gov/. Click on Economic Research and Data and then Statistics: Releases and Historical Data. Download the H 10 release Foreign Exchange Rates (weekly data available). What has happened to the value of the U.S. dollar relative to the Canadian dollar, Japanese yen, and Danish krone since June 25, 2010?
e. Using the information from (d), what has happened to the value of the U.S. dol- lar relative to the British pound and the euro? Note: The H.10 release quotes theseexcl hangelrates as U.S. dollars per unit of foreign currency in line with long -standing market conventions.
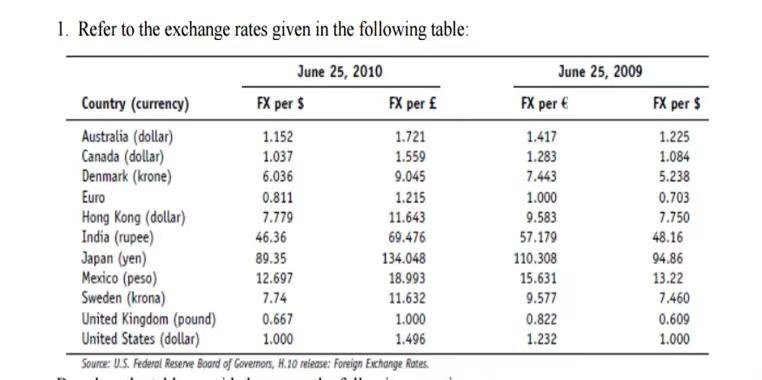
1. Refer to the exchange rates given in the following table: June 25, 2010 Country (currency) FX per $ FX per Australia (dollar) 1.152 1.721 Canada (dollar) 1.037 1.559 Denmark (krone) 6.036 9.045 Euro 0.811 1.215 Hong Kong (dollar) 7.779 11.643 India (rupee) 46.36 69.476 Japan (yen) 89.35 134.048 Mexico (peso) 12.697 18.993 Sweden (krona) 7.74 11.632 United Kingdom (pound) 0.667 1.000 United States (dollar) 1.000 1.496 Source: U.S. Federal Reserve Board of Governors, H. 10 niease: Foreign Exchange Rates June 25, 2009 FX per 1.417 1.283 7.443 1.000 9.583 57.179 110.308 15.631 9.577 0.822 1.232 FX per $ 1.225 1.084 5.238 0.703 7.750 48.16 94.86 13.22 7.460 0.609 1.000 1. Refer to the exchange rates given in the following table: June 25, 2010 Country (currency) FX per $ FX per Australia (dollar) 1.152 1.721 Canada (dollar) 1.037 1.559 Denmark (krone) 6.036 9.045 Euro 0.811 1.215 Hong Kong (dollar) 7.779 11.643 India (rupee) 46.36 69.476 Japan (yen) 89.35 134.048 Mexico (peso) 12.697 18.993 Sweden (krona) 7.74 11.632 United Kingdom (pound) 0.667 1.000 United States (dollar) 1.000 1.496 Source: U.S. Federal Reserve Board of Governors, H. 10 niease: Foreign Exchange Rates June 25, 2009 FX per 1.417 1.283 7.443 1.000 9.583 57.179 110.308 15.631 9.577 0.822 1.232 FX per $ 1.225 1.084 5.238 0.703 7.750 48.16 94.86 13.22 7.460 0.609 1.000
Step by Step Solution
There are 3 Steps involved in it

Get step-by-step solutions from verified subject matter experts