

Question: based on the table questiond 5 and 6. i want to say C for 6 but not sure Summary Statistics begin{tabular}{|l|} hline Average hline
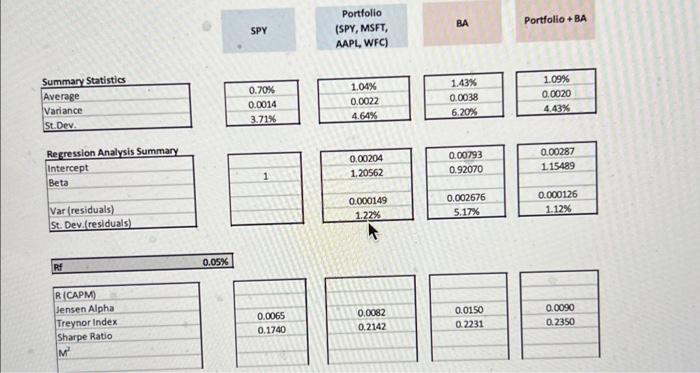
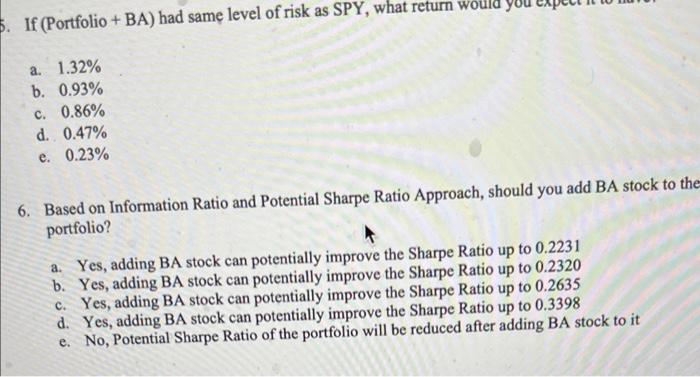
Summary Statistics \begin{tabular}{|l|} \hline Average \\ \hline Variance \\ \hline St.Dev. \\ \hline \end{tabular} \begin{tabular}{|l|} \hline 0.70% \\ \hline 0.0014 \\ \hline 3.71% \\ \hline \end{tabular} \begin{tabular}{|l|} \hline 1.04% \\ \hline 0.0022 \\ \hline 4.64% \\ \hline \end{tabular} \begin{tabular}{|c|} \hline 1.43% \\ \hline 0.0038 \\ \hline 6.20% \\ \hline \end{tabular} \begin{tabular}{|c|} \hline 1.09% \\ \hline 0.0020 \\ \hline 4.43% \\ \hline \end{tabular} Regression Analysis Summary \begin{tabular}{|l|} \hline Intercept \\ \hline Beta \\ \hline Var (residuals) \\ \hline St. Dev.(residuals) \\ \hline \end{tabular} \begin{tabular}{|l|} \hline 1 \\ \hline \end{tabular} \begin{tabular}{|c|} \hline 0.00287 \\ \hline 1.15489 \\ \hline 0.000126 \\ \hline 1.12% \\ \hline \end{tabular} \begin{tabular}{|lr|} \hline Rf & 0.05% \\ \hline \end{tabular} \begin{tabular}{|l|} \hline R(CAPM) \\ \hline Jensen Alpha \\ \hline Treynor index \\ \hline Sharpe Ratio \\ M2 \\ \hline \end{tabular} \begin{tabular}{|l|} \hline 0.0065 \\ \hline 0.1740 \\ \hline \end{tabular} \begin{tabular}{|c|} \hline 0.0082 \\ \hline 0.2142 \\ \hline \end{tabular} If (Portfolio + BA) had sam level of risk as SPY, what return wO a. 1.32% b. 0.93% c. 0.86% d. 0.47% e. 0.23% 6. Based on Information Ratio and Potential Sharpe Ratio Approach, should you add BA stock to the portfolio? a. Yes, adding BA stock can potentially improve the Sharpe Ratio up to 0.2231 b. Yes, adding BA stock can potentially improve the Sharpe Ratio up to 0.2320 c. Yes, adding BA stock can potentially improve the Sharpe Ratio up to 0.2635 d. Yes, adding BA stock can potentially improve the Sharpe Ratio up to 0.3398 e. No, Potential Sharpe Ratio of the portfolio will be reduced after adding BA stock to it
Step by Step Solution
There are 3 Steps involved in it

Get step-by-step solutions from verified subject matter experts