

Question: Based on the topics below, provide a detailed PowerPoint presentation guide with the script. The snippets are arranged in order as below. 1. 2. 3.
Based on the topics below, provide a detailed PowerPoint presentation guide with the script. The snippets are arranged in order as below.
1.
2.
3.
4.
5.

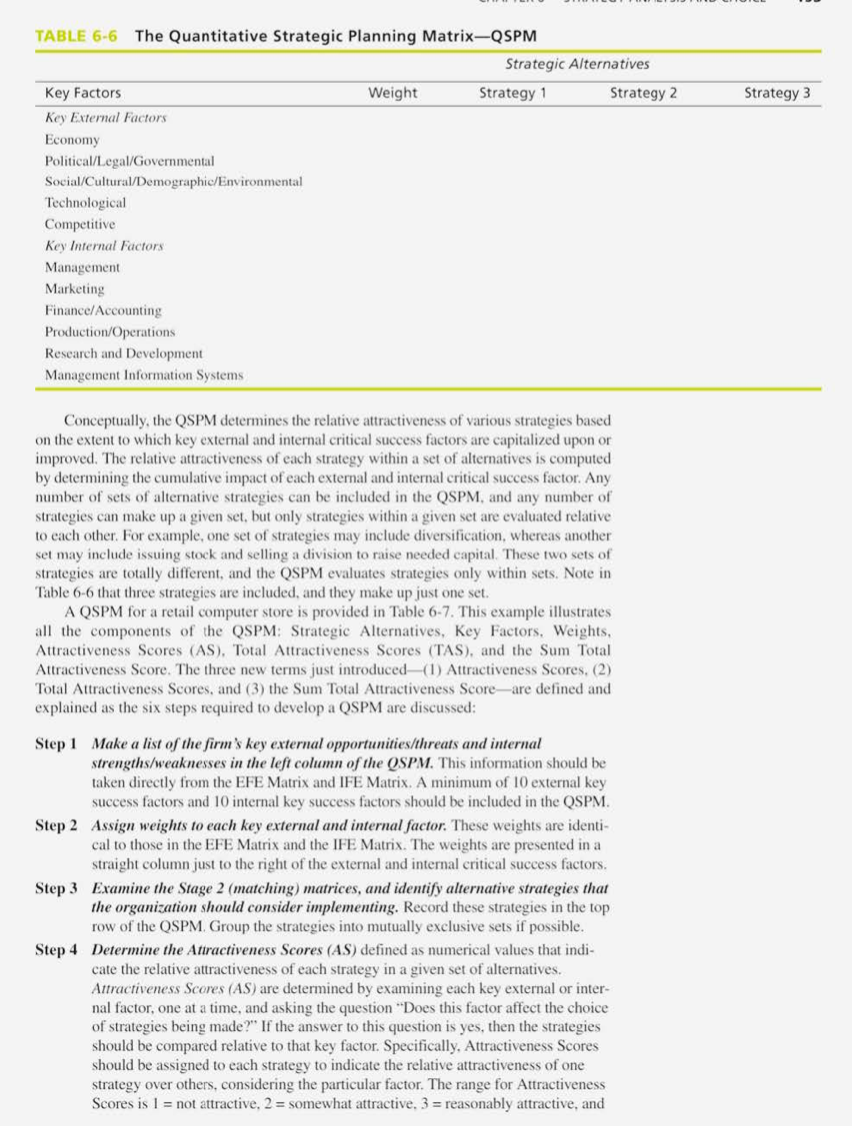
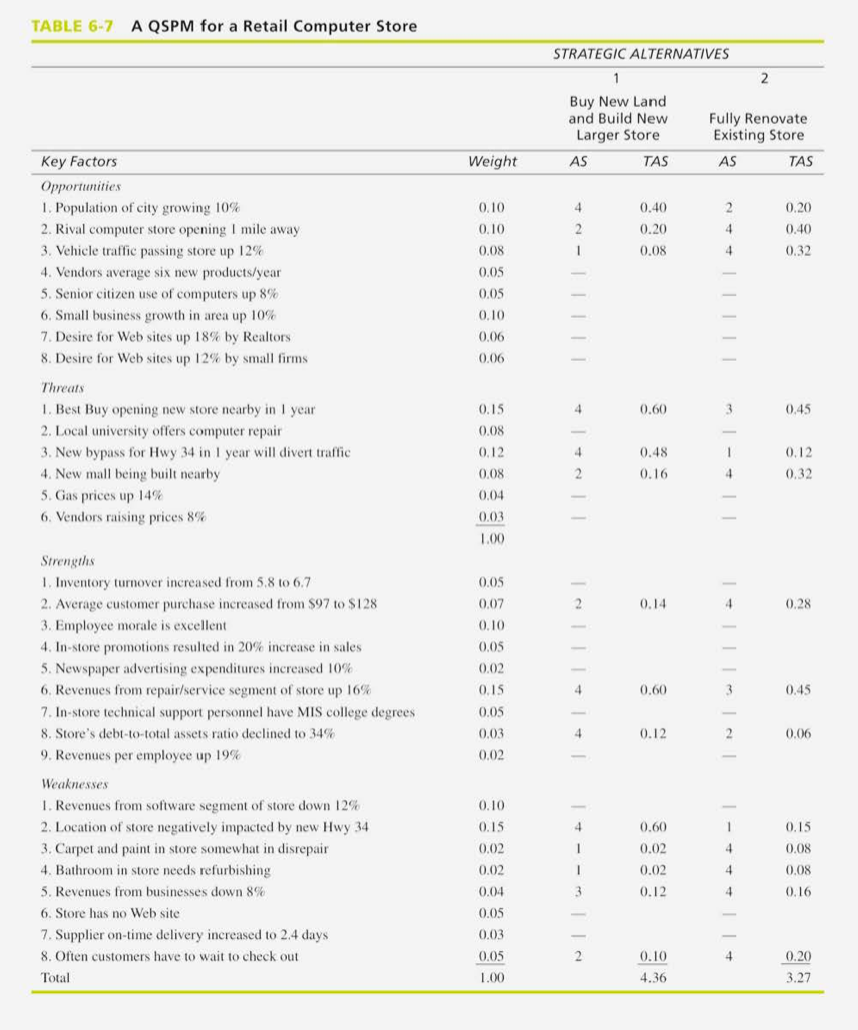
Conceptually, the QSPM determines the relative attractiveness of various strategies based on the extent to which key external and internal critical success factors are capitalized upon or improved. The relative attractiveness of each strategy within a set of alternatives is computed by determining the cumulative impact of each external and internal critical success factor. Any number of sets of alternative strategies can be included in the QSPM, and any number of strategies can make up a given set, but only strategies within a given set are evaluated relative to each other. For example, one set of strategies may include diversification, whereas another set may include issuing stock and selling a division to raise needed capital. These two sets of strategies are totally different, and the QSPM evaluates strategies only within sets. Note in Table 6-6 that three strategies are included, and they make up just one set. A QSPM for a retail computer store is provided in Table 6-7. This example illustrates all the components of the QSPM: Strategic Alternatives, Key Factors, Weights, Attractiveness Scores (AS), Total Attractiveness Scores (TAS), and the Sum Total Attractiveness Score. The three new terms just introduced-(1) Attractiveness Scores, (2) Total Attractiveness Scores, and (3) the Sum Total Attractiveness Score-are defined and explained as the six steps required to develop a QSPM are discussed: Step 1 Make a list of the firm's key external opportunities/threats and internal strengths/weaknesses in the left column of the QSPM. This information should be taken directly from the EFE Matrix and IFE Matrix. A minimum of 10 external key success factors and 10 internal key success factors should be included in the QSPM. Step 2 Assign weights to each key external and internal factor. These weights are identical to those in the EFE Matrix and the IFE Matrix. The weights are presented in a straight column just to the right of the external and internal critical success factors. Step 3 Examine the Stage 2 (matching) matrices, and identify alternative strategies that the organization should consider implementing. Record these strategies in the top row of the QSPM. Group the strategies into mutually exclusive sets if possible. Step 4 Determine the Attractiveness Scores (AS) defined as numerical values that indicate the relative attractiveness of each strategy in a given set of alternatives. Attractiveness Scores (AS) are determined by examining each key external or internal factor, one at a time, and asking the question "Does this factor affect the choice of strategies being made?" If the answer to this question is yes, then the strategies should be compared relative to that key factor. Specifically, Attractiveness Scores should be assigned to each strategy to indicate the relative attractiveness of one strategy over others, considering the particular factor. The range for Attractiveness Scores is 1 = not attractive, 2 = somewhat attractive, 3 = reasonably attractive, and
Step by Step Solution
There are 3 Steps involved in it

Get step-by-step solutions from verified subject matter experts