

Question: Based on the trends shown in the graph, which age group will be the largest group of voters by 2020? A. 18-24 A. 18-24 B.
Based on the trends shown in the graph, which age group will be the largest group of voters by 2020? A. 18-24 A. 18-24 B. 25-44 B. 25-44 C. 45-64 C. 45-64 D. 65 and over D. 65 and over
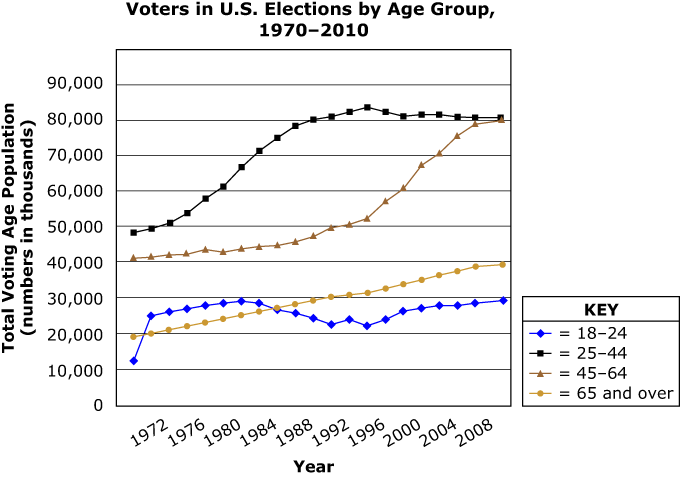 Voters in U.S. Elections by Age Group, 1970-2010 90,000 80,000 70,000 60,000 Total Voting Age Population (numbers in thousands) 50,000 40,000 30,000 KEY 20,000 = 18-24 25-44 10,000 = 45-64 0 = 65 and over 1972 1976 1980 1984 1988 1992 1996 2000 2004 2008 Year
Step by Step Solution
There are 3 Steps involved in it
1 Expert Approved Answer
Step: 1 Unlock

Question Has Been Solved by an Expert!
Get step-by-step solutions from verified subject matter experts
Step: 2 Unlock
Step: 3 Unlock