

Question: Based on the visualization in Lab 1 . 3 1 . 3 Power BI , , Assessing Product ( ( SKU ) ) Profitability, what
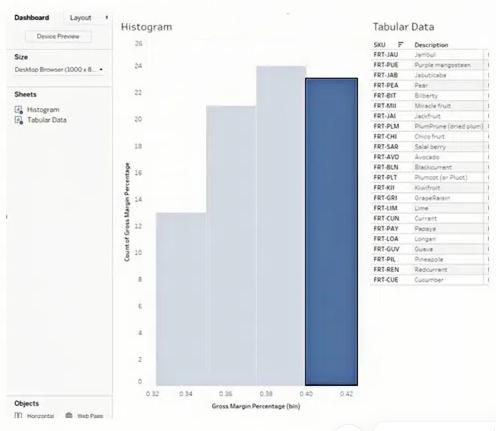
Dashboard Layout Histogram 26 24 Tabular Data SKU F Description FRT-JAU FRY-PUE Purple Device Preview Sure Desktop Browser (1000 Sheets 22 Histogram Tabular Data 20 Objects Pa Count of Gross Margin Percentage 2 032 1034 0.30 Gross Margin Percentage (in) 040 04 FRT-JAB FRT-PEA Pear FRT-BIT FRT MI FRT-JAI FRT-PLM FRT-CHI Miracle frut Pumprone (ned sum Onde trut FRT-SAQ Salaberry RT-AVO Avocate FRT-BLN BackUent FRT-PLT Puoluet) FRT-K FRT-GRI FRT-LIM Grape Live FRT-CUN Current FRT-PAY FRT LOA FRY-GUV FRT-PIL FRT REN FRECUE Quee Anespole Redcurrent Cucumber
Step by Step Solution
There are 3 Steps involved in it
Since the lowest bin of the histogram represents gross ... View full answer

Get step-by-step solutions from verified subject matter experts