

Question: based on the work that i did. how would i compare the 2 companies (CAT AND DE) to their own annual histories as well as
 based on the work that i did. how would i compare the 2 companies (CAT AND DE) to their own annual histories as well as each other? over the 3 years of finacials i have calcualted.
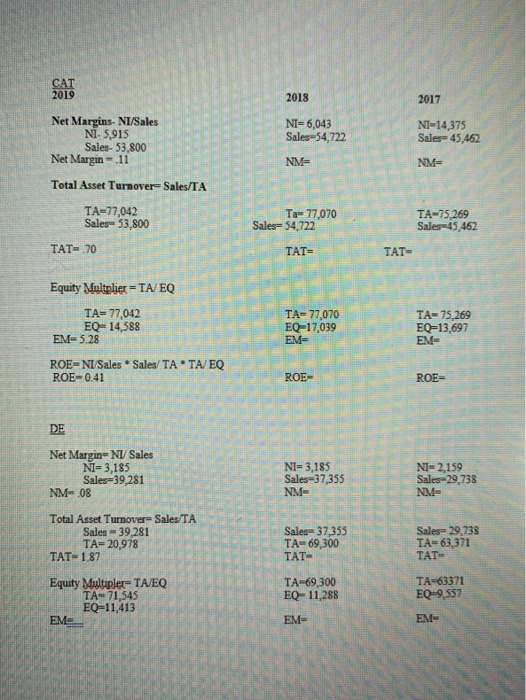
 CAT 2019 2018 2017 NI-6,043 Sales-54,722 NI=14,375 Sales=45,462 Net Margins-NI/Sales NI-5,915 Sales- 53,800 Net Margin-.11 Total Asset Turnover-Sales/TA NM- NM= TA=77,042 Sales= 53,800 Ta- 77,070 Sales 54,722 TA-75,269 Sales45,462 TAT= 70 TAT TAT Equity Multplier =TA/EQ TA=77,042 EQ=14,588 EM=5.28 TA-77,070 EQ=17,039 EM- TA=75,269 EQ=13,697 EM= ROE=NI Sales * Sales/ TATA/EQ ROE-0.41 ROE- ROE DE Net Margin-NI/Sales NI= 3,185 Sales=39,281 NM-08 NI= 3,185 Sales=37,355 NM- NI=2,159 Sales-29,738 NM- Total Asset Turnover-Sales TA Sales - 39,281 TA=20,978 TAT- 1.87 Sales 37,355 TA-69,300 TAT- Sales=29,738 TA=63,371 TAT Equity Multipler- TAJEQ TA- 71,545 EQ=11,413 EM TA=69,300 EQ-11,288 TA-63371 EQ-9,557 EM- EM
Step by Step Solution
There are 3 Steps involved in it

Get step-by-step solutions from verified subject matter experts