

Question: Based on the x-chart, the wire cutting process has been The control limits for the 3-aigma R-chart are (round all infermediate caloulations to three decimal
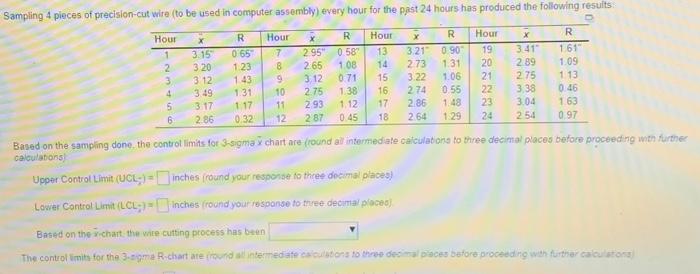
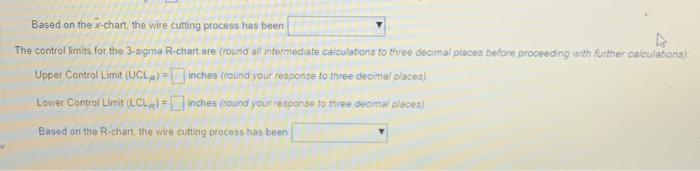
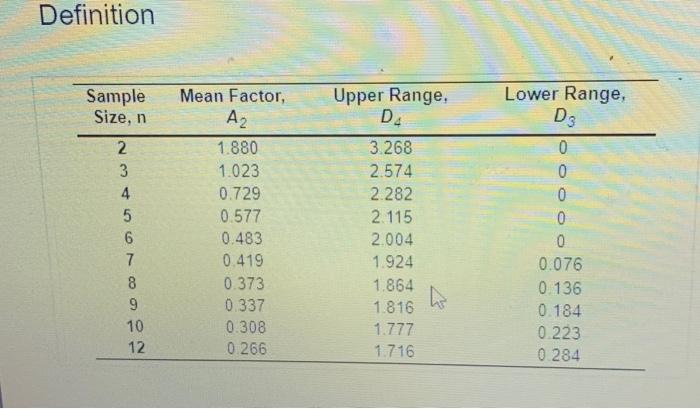
Based on the x-chart, the wire cutting process has been The control limits for the 3-aigma R-chart are (round all infermediate caloulations to three decimal places before proceeding inth further calculations) Upper Control Limit (UCt)= inches (round your response to three decimal places). Lower Control thitit (LCLF)= Inches (round your responce to three decinal pracest Based on the R-chart, the wire cuthing process has been Based on the sampling done, the controt limits for 3 sigma x chart are fround all intemediale catculatons to three decimal places before proceedirg wnth furthe calculations: Upper Control Limit (UCL; )= inches (round your response fo three docimal places) Based on the richart the wire cutting process has been Definition
Step by Step Solution
There are 3 Steps involved in it

Get step-by-step solutions from verified subject matter experts