

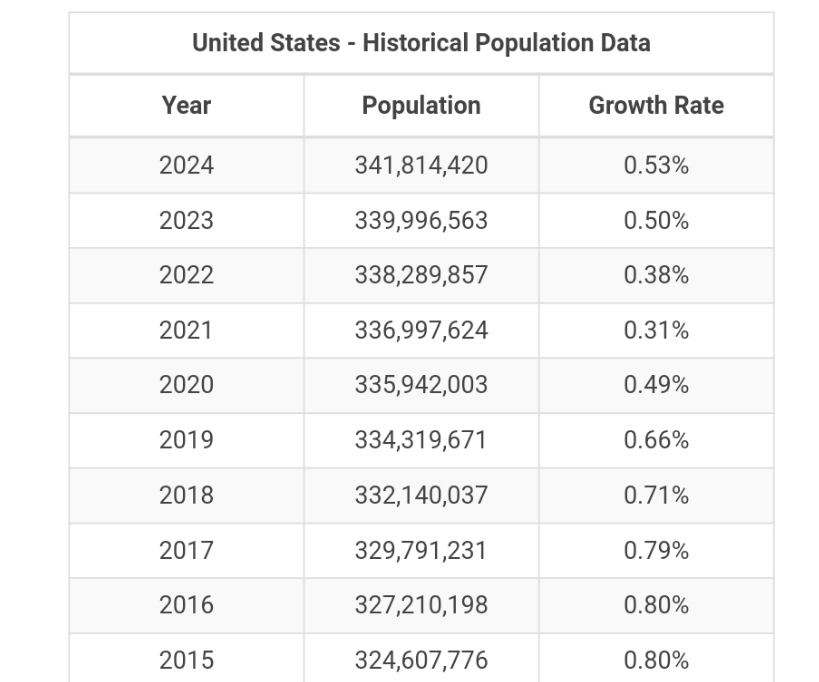
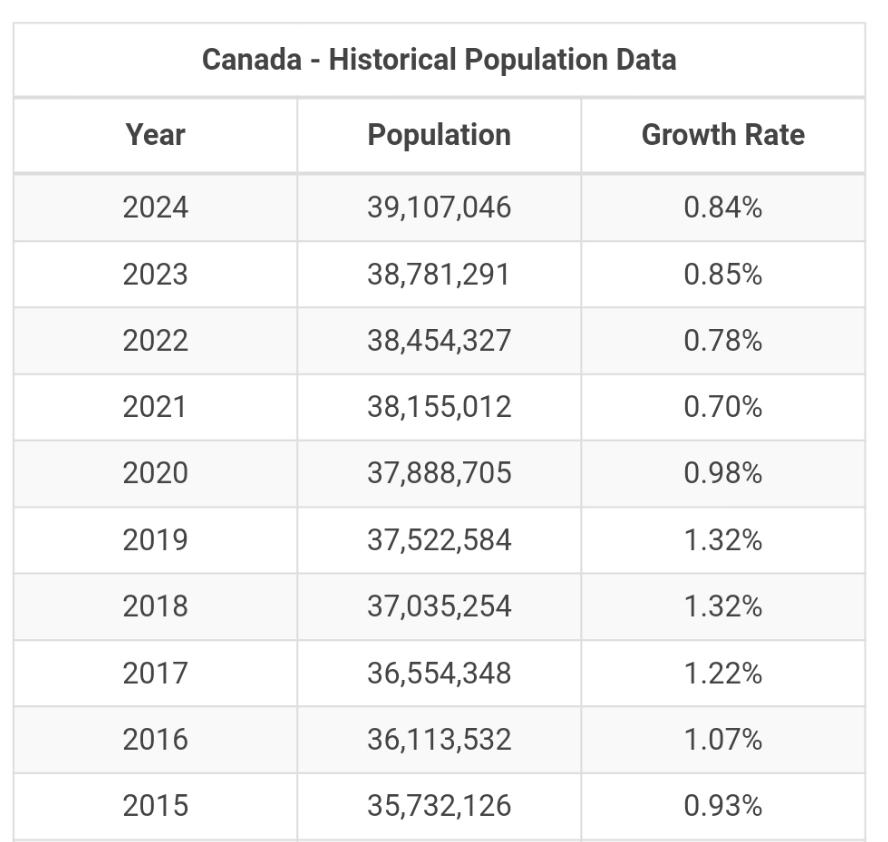
Question: based on this data below for U.SA population and Canada's population how do I make a graph based on the 10 years in desmos or
based on this data below for U.SA population and Canada's population how do I make a graph based on the 10 years in desmos or on a graphing calculator and figure out the regression equation? need to know how to graph the data to show the growth (exponentially) and how it defers from Canada's population
\f\f
Step by Step Solution
There are 3 Steps involved in it
1 Expert Approved Answer
Step: 1 Unlock

Question Has Been Solved by an Expert!
Get step-by-step solutions from verified subject matter experts
Step: 2 Unlock
Step: 3 Unlock