

Question: Based on this data, the Quality Manager should conclude that: The X-bar chart is the right chart to use in this situation. All the proportions
Based on this data, the Quality Manager should conclude that:
- The X-bar chart is the right chart to use in this situation.
- All the proportions (proportion of broken eggs in each sample) are inside the control limits
- There are assignable causes of variation
- The process is in control because all the sample ranges are inside the control limits
- Not enough information to decide whether the process is in or out of control
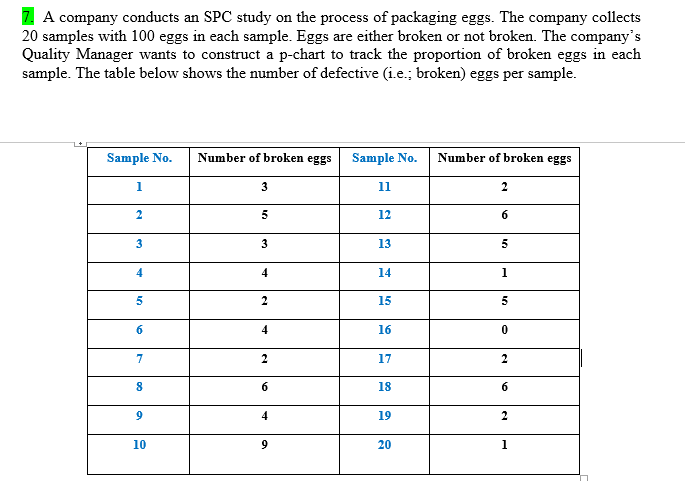
7. A company conducts an SPC study on the process of packaging eggs. The company collects 20 samples with 100 eggs in each sample. Eggs are either broken or not broken. The company's Quality Manager wants to construct a p-chart to track the proportion of broken eggs in each sample. The table below shows the number of defective (i.e.; broken) eggs per sample. Sample No. Number of broken eggs Sample No. Number of broken eggs 1 3 11 2 2 5 12 6 3 3 13 5 4 4 14 1 5 2 15 5 6 4 16 0 7 2 17 2 8 6 18 6 9 4 19 2 10 9 20
Step by Step Solution
There are 3 Steps involved in it
1 Expert Approved Answer
Step: 1 Unlock

Question Has Been Solved by an Expert!
Get step-by-step solutions from verified subject matter experts
Step: 2 Unlock
Step: 3 Unlock