

Question: Based on this data, what conclusion can be made?1. Reject H0 and conclude there is sufficient evidence to support the claim that this sample comes
Based on this data, what conclusion can be made?1. Reject H0 and conclude there is sufficient evidence to support the claim that this sample comes from a population with a mean score greater than 38.362. Reject H0 and conclude there is Not sufficient evidence to support the claim that this sample comes from a population with a mean score greater than 38.363. Accept H0 and conclude and there is sufficient evidence to support the claim that this sample comes from a population with a mean score greater than 38.364. Fail to Reject H0 and conclude there is sufficient evidence to support the claim that this sample comes from a population with a mean score greater than 38.365. Fail to Reject H0 and conclude there is Not sufficient evidence to support the claim that this sample comes from a population with a mean score greater than 38.36
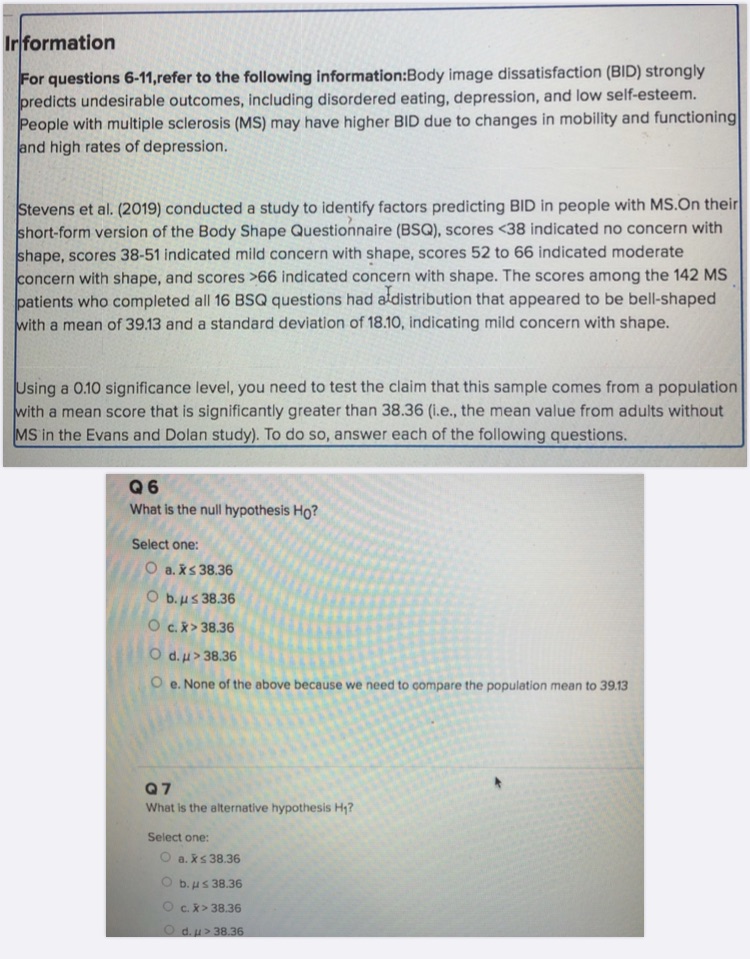
Ir formation For questions 6-11,refer to the following information:Body image dissatisfaction (BID) strongly predicts undesirable outcomes, including disordered eating, depression, and low self-esteem. People with multiple sclerosis (MS) may have higher BID due to changes in mobility and functioning and high rates of depression. Stevens et al. (2019) conducted a study to identify factors predicting BID in people with MS.On their short-form version of the Body Shape Questionnaire (BSQ), scores 66 indicated concern with shape. The scores among the 142 MS patients who completed all 16 BSQ questions had aldistribution that appeared to be bell-shaped with a mean of 39.13 and a standard deviation of 18.10, indicating mild concern with shape. Using a 0.10 significance level, you need to test the claim that this sample comes from a population with a mean score that is significantly greater than 38.36 (i.e., the mean value from adults without MS in the Evans and Dolan study). To do so, answer each of the following questions. Q 6 What is the null hypothesis Ho? Select one: O a. Xs 38.36 O b. H S 38.36 O c. X> 38.36 O d. ( > 38.36 O e. None of the above because we need to compare the population mean to 39.13 Q7 What is the alternative hypothesis H1? Select one: O a. X s 38.36 O b. H S 38.36 O c. X> 38.36 O d. ( > 38.36
Step by Step Solution
There are 3 Steps involved in it

Get step-by-step solutions from verified subject matter experts