

Question: Based on this financiaI statement What are the Iiquidity, efficiency, debt, and profitabiIity ratios ? S figures in millions Actual Estimate Estimate Estimate Estimate Estimate
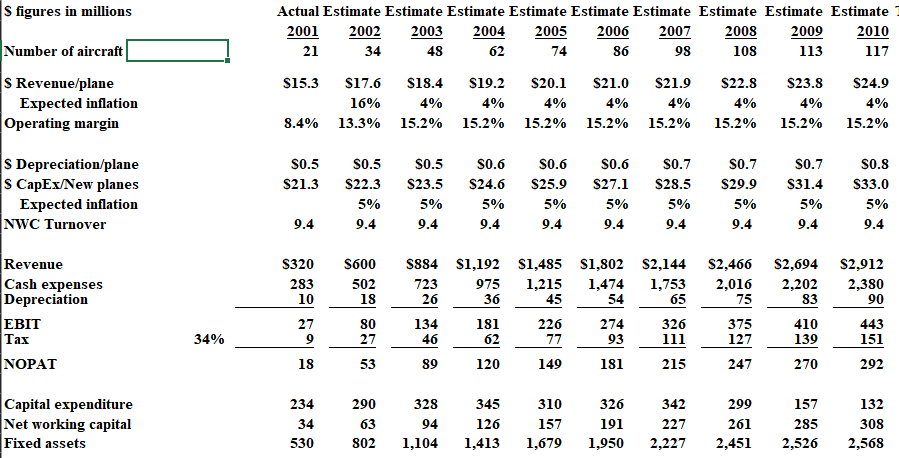
Based on this financiaI statement
What are the Iiquidity, efficiency, debt, and profitabiIity ratios ?
S figures in millions Actual Estimate Estimate Estimate Estimate Estimate Estimate Estimate Estimate Estimate 2001 2002 2003 2004 2005 2006 2007 2008 2009 2010 21 34 48 62 74 86 98 108 113 117 Number of aircraft S Revenue/plane Expected inflation Operating margin $15.3 $17.6 16% 13.3% $18.4 4% 15.2% $19.2 4% 15.2% $20.1 4% 15.2% $21.0 4% 15.2% $21.9 4% 15.2% $22.8 4% 15.2% $23.8 4% 15.2% $24.9 4% 15.2% 8.4% S0.6 S Depreciation/plane S CapEx/New planes Expected inflation NWC Turnover $0.5 $21.3 S0.7 $31.4 30.5 $22.3 5% 9.4 $0.5 $23.5 5% 9.4 $24.6 5% 9.4 S0.6 $25.9 5% 9.4 S0.6 $27.1 5% S0.7 $28.5 5% 9.4 S0.7 $29.9 5% 9.4 $0.8 $33.0 5% 9.4 5% 9.4 9.4 9.4 S320 283 10 S600 502 18 $2,466 2,016 75 $2,694 2,202 83 $2,912 2,380 90 Revenue Cash expenses Depreciation EBIT Tax NOPAT S884 $1,192 $1,485 $1,802 $2,144 723 975 1,215 1,474 1,753 26 36 45 54 65 134 181 226 274 326 46 62 77 93 111 89 120 149 181 215 27 9 80 27 375 127 410 139 443 151 34% 18 53 247 270 292 Capital expenditure Net working capital Fixed assets 234 34 530 290 63 802 328 94 1,104 345 126 1,413 310 157 1,679 326 191 1,950 342 227 2,227 299 261 2,451 157 285 2,526 132 308 2,568 S figures in millions Actual Estimate Estimate Estimate Estimate Estimate Estimate Estimate Estimate Estimate 2001 2002 2003 2004 2005 2006 2007 2008 2009 2010 21 34 48 62 74 86 98 108 113 117 Number of aircraft S Revenue/plane Expected inflation Operating margin $15.3 $17.6 16% 13.3% $18.4 4% 15.2% $19.2 4% 15.2% $20.1 4% 15.2% $21.0 4% 15.2% $21.9 4% 15.2% $22.8 4% 15.2% $23.8 4% 15.2% $24.9 4% 15.2% 8.4% S0.6 S Depreciation/plane S CapEx/New planes Expected inflation NWC Turnover $0.5 $21.3 S0.7 $31.4 30.5 $22.3 5% 9.4 $0.5 $23.5 5% 9.4 $24.6 5% 9.4 S0.6 $25.9 5% 9.4 S0.6 $27.1 5% S0.7 $28.5 5% 9.4 S0.7 $29.9 5% 9.4 $0.8 $33.0 5% 9.4 5% 9.4 9.4 9.4 S320 283 10 S600 502 18 $2,466 2,016 75 $2,694 2,202 83 $2,912 2,380 90 Revenue Cash expenses Depreciation EBIT Tax NOPAT S884 $1,192 $1,485 $1,802 $2,144 723 975 1,215 1,474 1,753 26 36 45 54 65 134 181 226 274 326 46 62 77 93 111 89 120 149 181 215 27 9 80 27 375 127 410 139 443 151 34% 18 53 247 270 292 Capital expenditure Net working capital Fixed assets 234 34 530 290 63 802 328 94 1,104 345 126 1,413 310 157 1,679 326 191 1,950 342 227 2,227 299 261 2,451 157 285 2,526 132 308 2,568
Step by Step Solution
There are 3 Steps involved in it

Get step-by-step solutions from verified subject matter experts