

Question: Based on this imageOne-Variable Data Table (1)You need to perform some analysis on Gross and Net Profit based on different averages of board feet per
Based on this imageOne-Variable Data Table (1)You need to perform some analysis on Gross and Net Profit based on different averages of board feet per plonb. Complete a series of substitutions starting in cell F4, starting at 10000 in increments of 500 and a max of 13000, going down vertically.Enter the references for Gross Profit and Net Profit, respectively, in cells G3 and H3.Complete the one-variable data table.Format the results to Accounting Number Format with Zero decimal places.
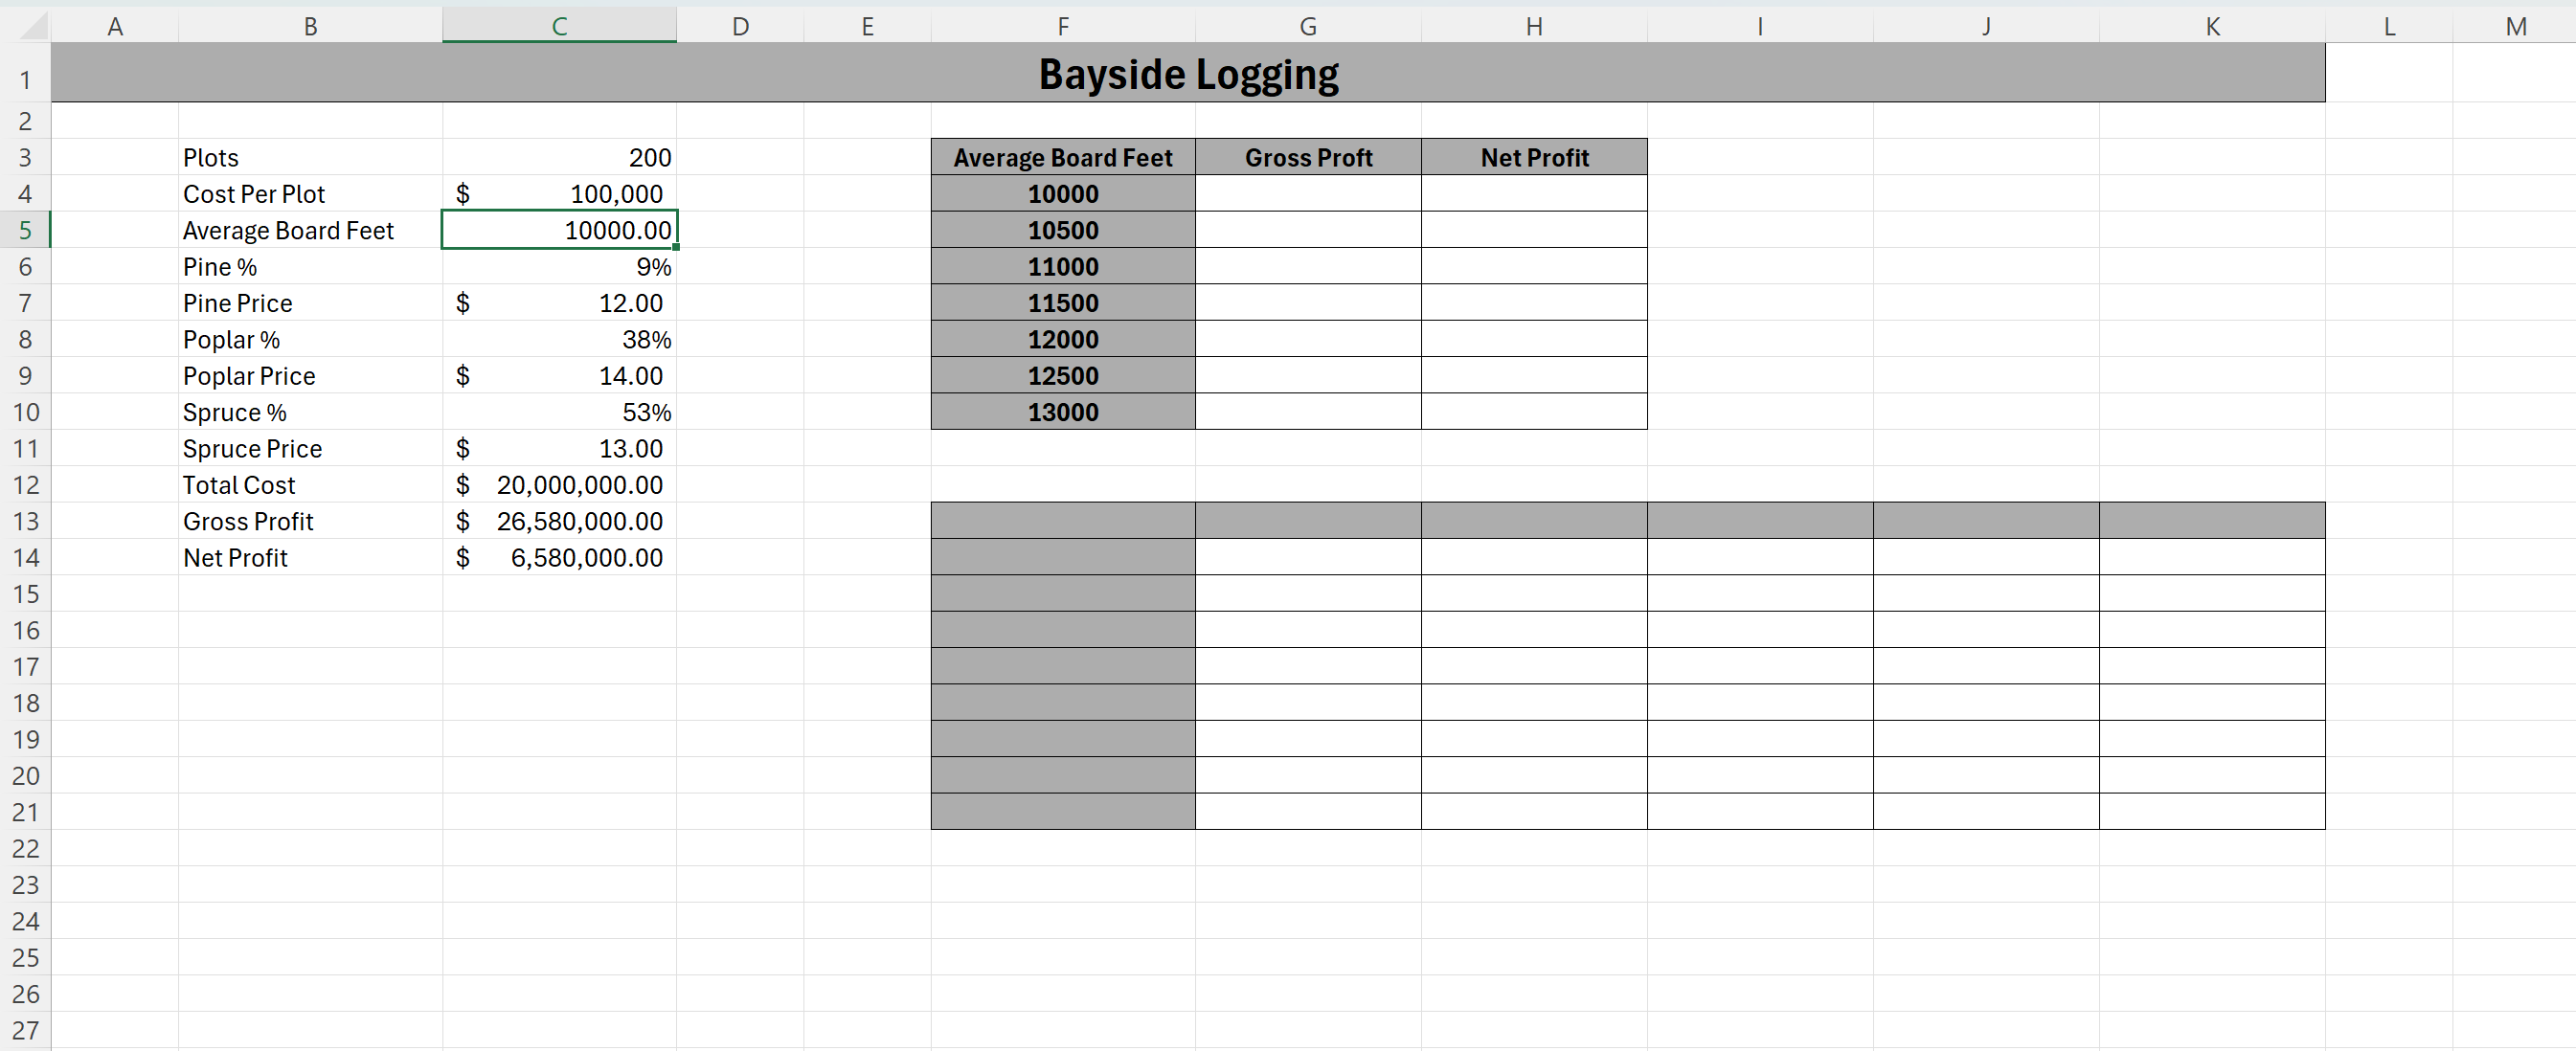
Plots Cost Per Plot Average Board Feet Pine % Pine Price Poplar % Poplar Price Spruce % Spruce Price Total Cost Gross Profit Net Profit $ $ @ P P B 200 100,000 10000.00 9% 12.00 38% 14.00 53% 13.00 20,000,000.00 26,580,000.00 6,580,000.00
Step by Step Solution
There are 3 Steps involved in it

Get step-by-step solutions from verified subject matter experts