

Question: based on this information, how would you use this research question and analyize this chart? here is an example of the questions we are being
 based on this information, how would you use this research question and analyize this chart?
here is an example of the questions we are being asked
A. Accurately analyze the data using the appropriate descriptive statistics. B. Construct appropriate tables or graphs to accurately display the results of the data analysis. Include explanations of the meaning of the information presented. C. Accurately analyze the data using the appropriate inferential statistics. Be sure to include the output. D. Explain the meaning of the results of your data analysis in practical terms (e.g., what were the results? What results were expected? What results were unexpected? What results were unsettling?).
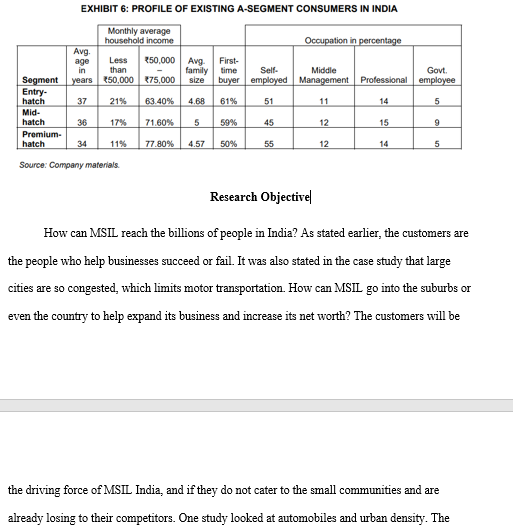
EXHIBIT 6: PROFILE OF EXISTING A-SEGMENT CONSUMERS IN INDIA Source: Company materials. Research Objective How can MSIL reach the billions of people in India? As stated earlier, the customers are the people who help businesses succeed or fail. It was also stated in the case study that large cities are so congested, which limits motor transportation. How can MSIL go into the suburbs or even the country to help expand its business and increase its net worth? The customers will be the driving force of MSIL India, and if they do not cater to the small communities and are already losing to their competitors. One study looked at automobiles and urban density. The
Step by Step Solution
There are 3 Steps involved in it

Get step-by-step solutions from verified subject matter experts