

Question: Based on what you learned in the Economic Impact Analysis slide deck, you will conduct an Economic Impact Analysis for the IHSA State Football Championships
Based on what you learned in the "Economic Impact Analysis" slide deck, you will conduct an Economic Impact Analysis for the IHSA State Football Championships in Campaign County.
Please use the readings and look at the case study example and answers that were provided in the Module 8 readings. Also, please refer to the examples in the Chapter 12/Economic Impact Slide Deck.
You must complete BOTH the attached PowerPoint and Excel files. For the Excel file, you should use equations to demonstrate that you have a clear understanding of how to calculate these values (i.e., the cells that are shaded in YELLOW). The PowerPoint simply needs to have the numbers that you calculate in the excel file. The power point has some questions at the end that you will be asked to answer. You must submit both the PowerPoint and Excel files. As always, please ask questions if you have them. 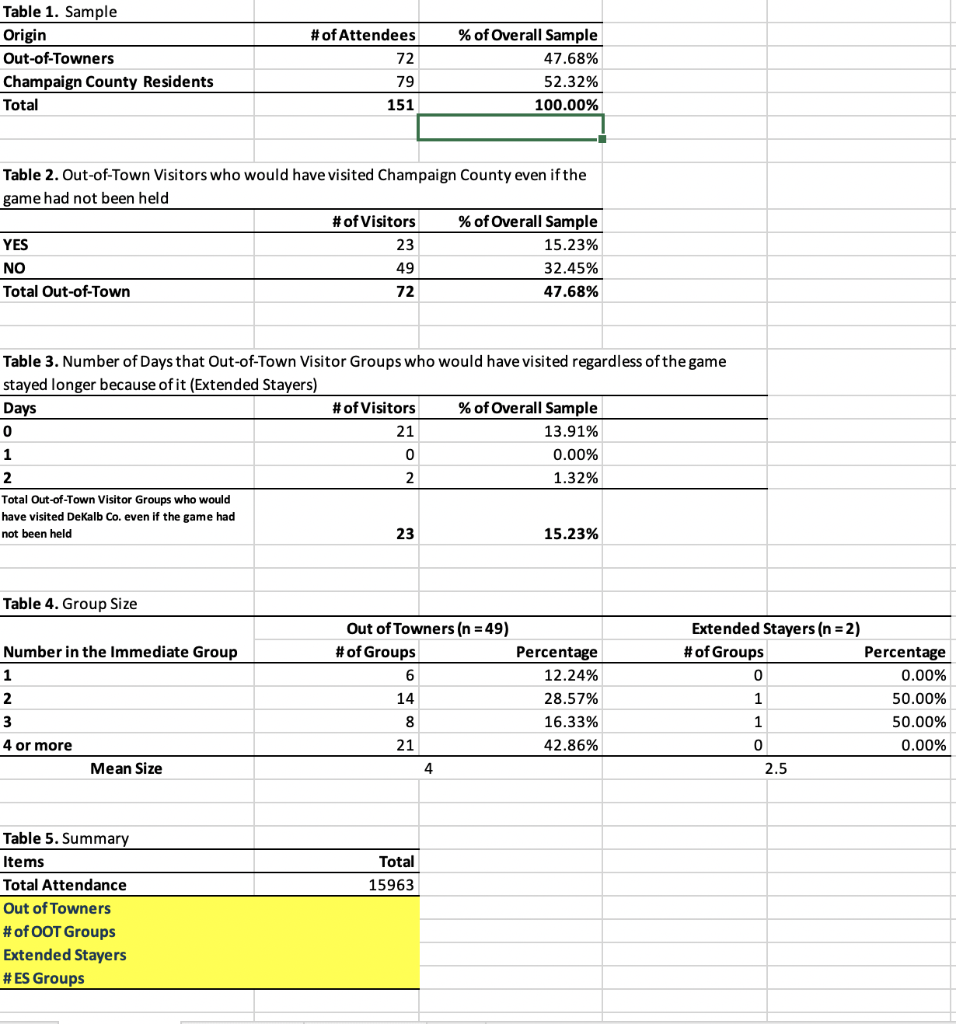
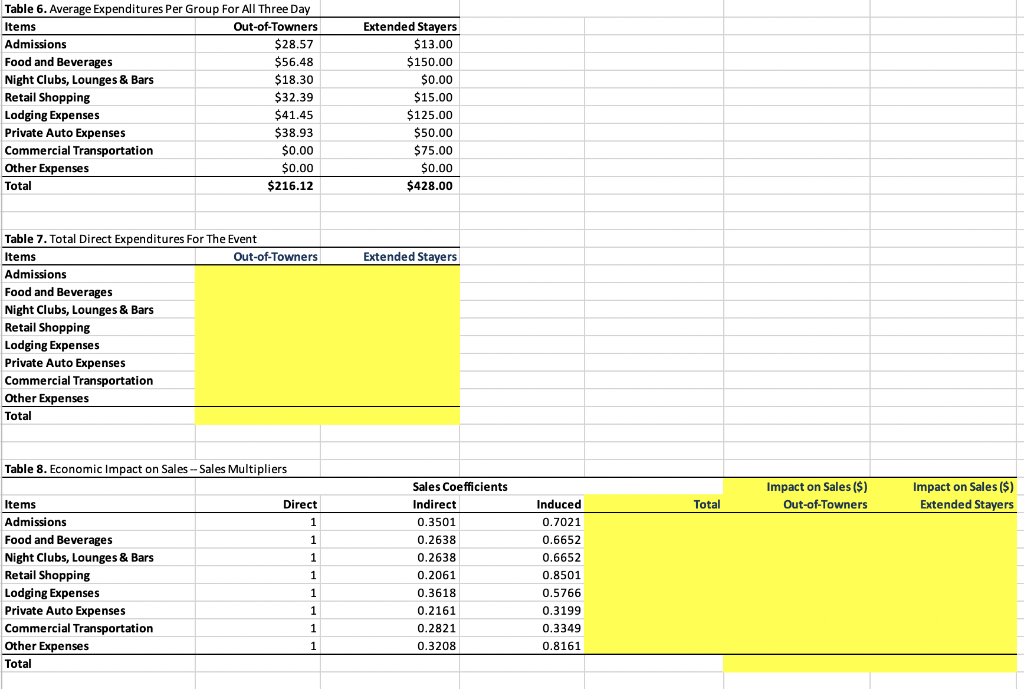
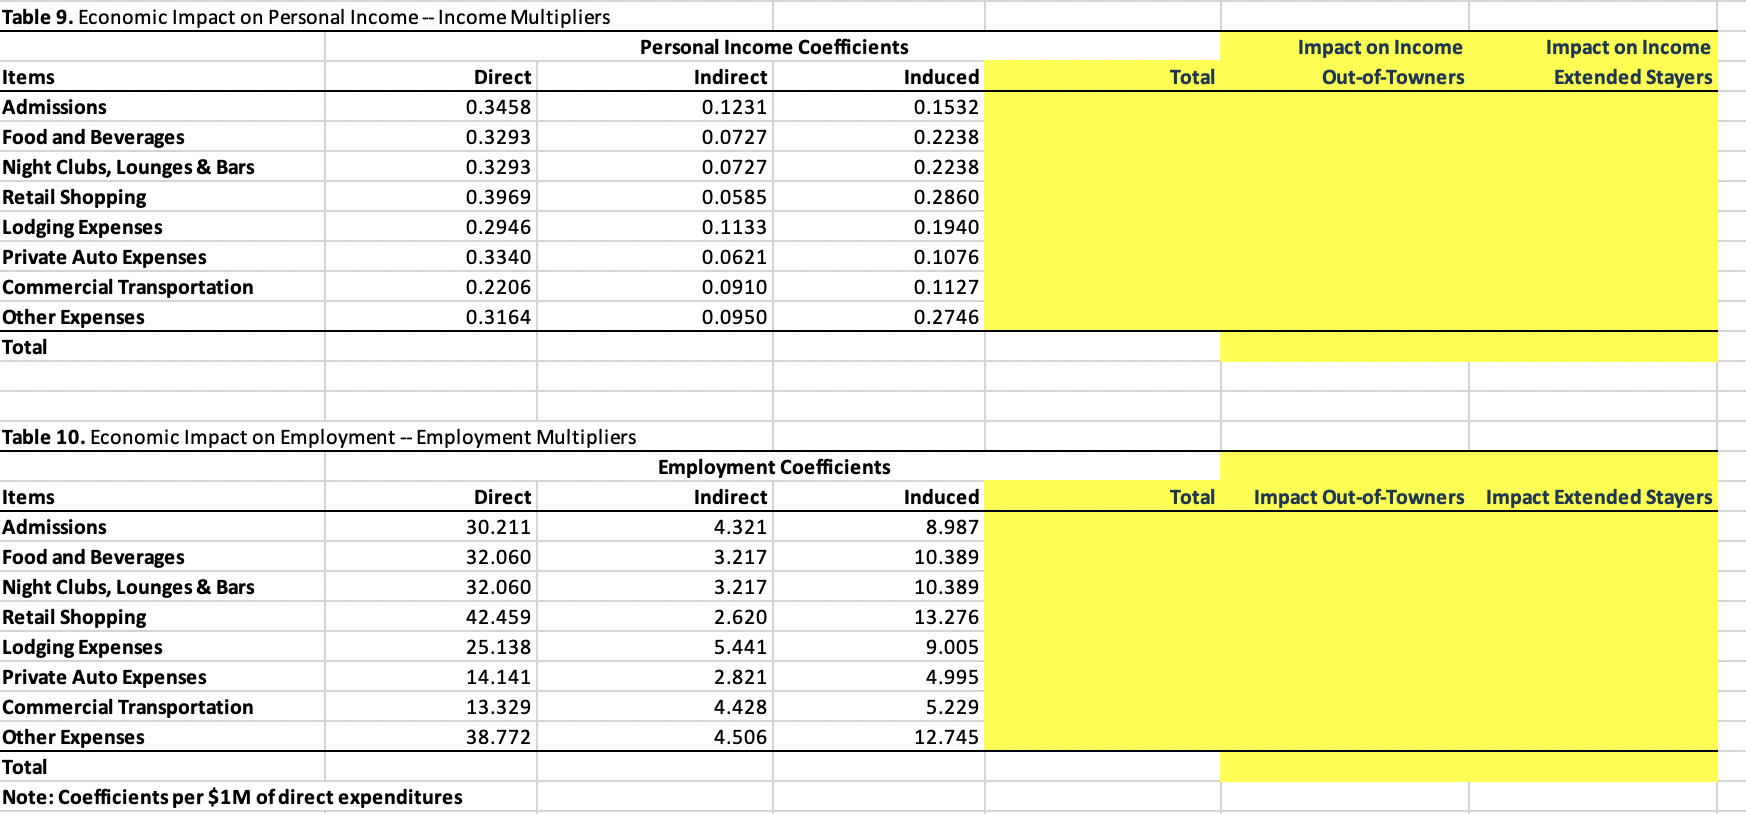
# of Attendees Table 1. Sample Origin Out-of-Towners Champaign County Residents Total 72 % of Overall Sample 47.68% 52.32% 100.00% 79 151 Table 2. Out-of-Town Visitors who would have visited Champaign County even if the game had not been held # of Visitors % of Overall Sample YES 23 15.23% NO 49 32.45% Total Out-of-Town 72 47.68% Table 3. Number of Days that Out-of-Town Visitor Groups who would have visited regardless of the game stayed longer because of it (Extended Stayers) Days # of Visitors % of Overall Sample 0 21 13.91% 1 0 0.00% 2 2 1.32% Total Out-of-Town Visitor Groups who would have visited DeKalb Co. even if the game had not been held 23 15.23% Table 4. Group Size Number in the Immediate Group 1 2 3 Out of Towners (n = 49) # of Groups Percentage 6 12.24% 14 28.57% 8 16.33% 21 42.86% 4 Extended Stayers (n=2) #of Groups Percentage 0 0.00% 1 50.00% 1 50.00% 0 0.00% 2.5 4 or more Mean Size Total 15963 Table 5. Summary Items Total Attendance Out of Towners # of OOT Groups Extended Stayers #ES Groups Extended Stayers $13.00 $150.00 $0.00 Table 6. Average Expenditures Per Group For All Three Day Items Out-of-Towners Admissions $28.57 Food and Beverages $56.48 Night Clubs, Lounges & Bars $18.30 Retail Shopping $32.39 Lodging Expenses $41.45 Private Auto Expenses $38.93 Commercial Transportation $0.00 Other Expenses $0.00 Total $216.12 $15.00 $125.00 $50.00 $75.00 $0.00 $428.00 Extended Stayers Table 7. Total Direct Expenditures For The Event Items Out-of-Towners Admissions Food and Beverages Night Clubs, Lounges & Bars Retail Shopping Lodging Expenses Private Auto Expenses Commercial Transportation Other Expenses Total Table 8. Economic Impact on Sales --Sales Multipliers Impact on Sales ($) Out-of-Towners Impact on Sales ($) Extended Stayers Direct Total Sales Coefficients Indirect 0.3501 0.2638 Induced 0.7021 1 1 0.6652 1 1 Items Admissions Food and Beverages Night Clubs, Lounges & Bars Retail Shopping Lodging Expenses Private Auto Expenses Commercial Transportation Other Expenses Total 1 0.2638 0.2061 0.3618 0.2161 0.2821 0.3208 0.6652 0.8501 0.5766 0.3199 0.3349 0.8161 1 1 1 Table 9. Economic Impact on Personal Income -- Income Multipliers Impact on Income Out-of-Towners Impact on Income Extended Stayers Direct Total Items Admissions Food and Beverages Night Clubs, Lounges & Bars Retail Shopping Lodging Expenses Private Auto Expenses Commercial Transportation Other Expenses Total 0.3458 0.3293 0.3293 0.3969 0.2946 0.3340 0.2206 0.3164 Personal Income Coefficients Indirect Induced 0.1231 0.1532 0.0727 0.2238 0.0727 0.2238 0.0585 0.2860 0.1133 0.1940 0.0621 0.1076 0.0910 0.1127 0.0950 0.2746 Table 10. Economic Impact on Employment -- Employment Multipliers Total Impact Out-of-Towners Impact Extended Stayers Items Direct Admissions 30.211 Food and Beverages 32.060 Night Clubs, Lounges & Bars 32.060 Retail Shopping 42.459 Lodging Expenses 25.138 Private Auto Expenses 14.141 Commercial Transportation 13.329 Other Expenses 38.772 Total Note: Coefficients per $1M of direct expenditures Employment Coefficients Indirect 4.321 3.217 3.217 2.620 5.441 2.821 4.428 4.506 Induced 8.987 10.389 10.389 13.276 9.005 4.995 5.229 12.745 # of Attendees Table 1. Sample Origin Out-of-Towners Champaign County Residents Total 72 % of Overall Sample 47.68% 52.32% 100.00% 79 151 Table 2. Out-of-Town Visitors who would have visited Champaign County even if the game had not been held # of Visitors % of Overall Sample YES 23 15.23% NO 49 32.45% Total Out-of-Town 72 47.68% Table 3. Number of Days that Out-of-Town Visitor Groups who would have visited regardless of the game stayed longer because of it (Extended Stayers) Days # of Visitors % of Overall Sample 0 21 13.91% 1 0 0.00% 2 2 1.32% Total Out-of-Town Visitor Groups who would have visited DeKalb Co. even if the game had not been held 23 15.23% Table 4. Group Size Number in the Immediate Group 1 2 3 Out of Towners (n = 49) # of Groups Percentage 6 12.24% 14 28.57% 8 16.33% 21 42.86% 4 Extended Stayers (n=2) #of Groups Percentage 0 0.00% 1 50.00% 1 50.00% 0 0.00% 2.5 4 or more Mean Size Total 15963 Table 5. Summary Items Total Attendance Out of Towners # of OOT Groups Extended Stayers #ES Groups Extended Stayers $13.00 $150.00 $0.00 Table 6. Average Expenditures Per Group For All Three Day Items Out-of-Towners Admissions $28.57 Food and Beverages $56.48 Night Clubs, Lounges & Bars $18.30 Retail Shopping $32.39 Lodging Expenses $41.45 Private Auto Expenses $38.93 Commercial Transportation $0.00 Other Expenses $0.00 Total $216.12 $15.00 $125.00 $50.00 $75.00 $0.00 $428.00 Extended Stayers Table 7. Total Direct Expenditures For The Event Items Out-of-Towners Admissions Food and Beverages Night Clubs, Lounges & Bars Retail Shopping Lodging Expenses Private Auto Expenses Commercial Transportation Other Expenses Total Table 8. Economic Impact on Sales --Sales Multipliers Impact on Sales ($) Out-of-Towners Impact on Sales ($) Extended Stayers Direct Total Sales Coefficients Indirect 0.3501 0.2638 Induced 0.7021 1 1 0.6652 1 1 Items Admissions Food and Beverages Night Clubs, Lounges & Bars Retail Shopping Lodging Expenses Private Auto Expenses Commercial Transportation Other Expenses Total 1 0.2638 0.2061 0.3618 0.2161 0.2821 0.3208 0.6652 0.8501 0.5766 0.3199 0.3349 0.8161 1 1 1 Table 9. Economic Impact on Personal Income -- Income Multipliers Impact on Income Out-of-Towners Impact on Income Extended Stayers Direct Total Items Admissions Food and Beverages Night Clubs, Lounges & Bars Retail Shopping Lodging Expenses Private Auto Expenses Commercial Transportation Other Expenses Total 0.3458 0.3293 0.3293 0.3969 0.2946 0.3340 0.2206 0.3164 Personal Income Coefficients Indirect Induced 0.1231 0.1532 0.0727 0.2238 0.0727 0.2238 0.0585 0.2860 0.1133 0.1940 0.0621 0.1076 0.0910 0.1127 0.0950 0.2746 Table 10. Economic Impact on Employment -- Employment Multipliers Total Impact Out-of-Towners Impact Extended Stayers Items Direct Admissions 30.211 Food and Beverages 32.060 Night Clubs, Lounges & Bars 32.060 Retail Shopping 42.459 Lodging Expenses 25.138 Private Auto Expenses 14.141 Commercial Transportation 13.329 Other Expenses 38.772 Total Note: Coefficients per $1M of direct expenditures Employment Coefficients Indirect 4.321 3.217 3.217 2.620 5.441 2.821 4.428 4.506 Induced 8.987 10.389 10.389 13.276 9.005 4.995 5.229 12.745
Step by Step Solution
There are 3 Steps involved in it

Get step-by-step solutions from verified subject matter experts