

Question: Based on what you've learned in Chapter 3, calculate the following 10: Sample size: conduct a COUNT via formula of the data in your spreadsheet
Based on what you've learned in Chapter 3,calculate the following 10:
Sample size: conduct a COUNT via formula of the data in your spreadsheet
Sample Mean of Sales: use formula
Sample Standard Deviation of Sales: use formula
Confidence Level: 95% (use this number)
Standard Error: Sample STDEV divided by SQRT of sample size
Alpha: 5% (1 minus the confidence level, 95% in this case)
Degrees of Freedom: Sample size minus 1
t-Value: TINV(Alpha, Degrees of Freedom)
Half-Width: t Value *Standard Error of the Mean
Lower Limit Total Sales: Sample Mean - Interval Half Width
(or /and) Upper Limit Total Sales: Sample Mean + Interval Half Width
Please complete all calculations in the Excel file provided to you. Save your file with yourFirstname_lastnameand submit in the designated area. This assignment will be graded based on the formulas that you applied. Thus, make sure you use them! In a short paragraph,within the spreadsheet, explain why this analysis might be important to a business owner.What does the data tell you? Please be mindful of the submission deadline!
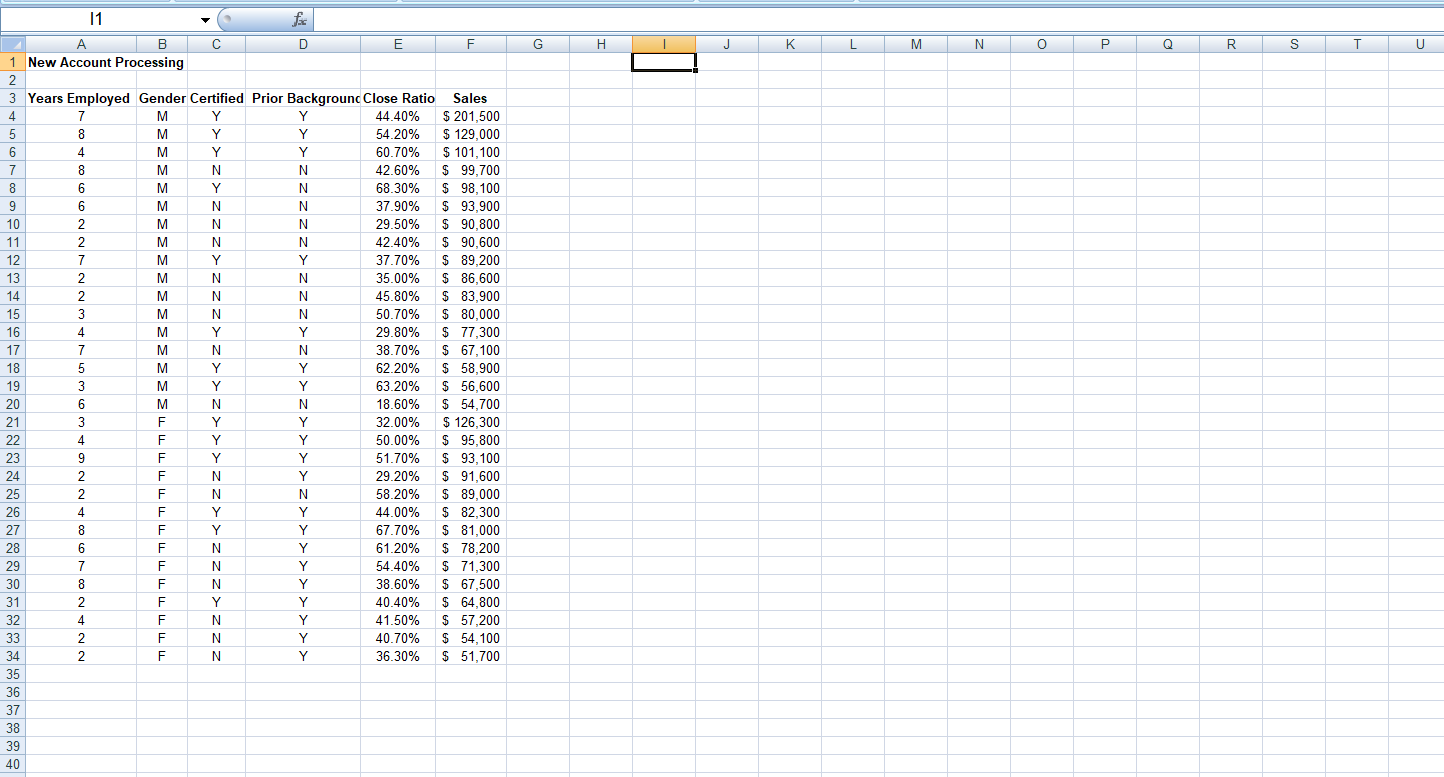
11 B C D E F G H J K L M N O P Q R S T U A 1 New Account Processing N 3 Years Employed Gender Certified Prior BackgroundClose Ratio Sales 7 M Y 44.40% $ 201,500 M Y 54.20% $ 129,000 M Y 60.70% $ 101, 100 M N 42.60% $ 99,700 M N 68.30% $ 98, 100 N 37.90% 93,900 M N 29.50% 90,800 N 42.40% 90,600 Y 37.70% $ 89,200 N 35.00% 6 86,600 N 45.80% 83,900 N 50.70% 6 80,000 29.80% $ 77,300 N 38.70% 67, 100 62.20% 58,900 63.20% 56,600 NNANONG OP N NOPWOWGNAWNN NNOGOPO 18.60% 6 54,700 32.00% $ 126,300 Z Z Z
Step by Step Solution
There are 3 Steps involved in it

Get step-by-step solutions from verified subject matter experts