

Question: Based on your NPV Scenario / Risk Analysis Grids, is NPV more sensitive to changing cost of capital or changing salvage values? How do you
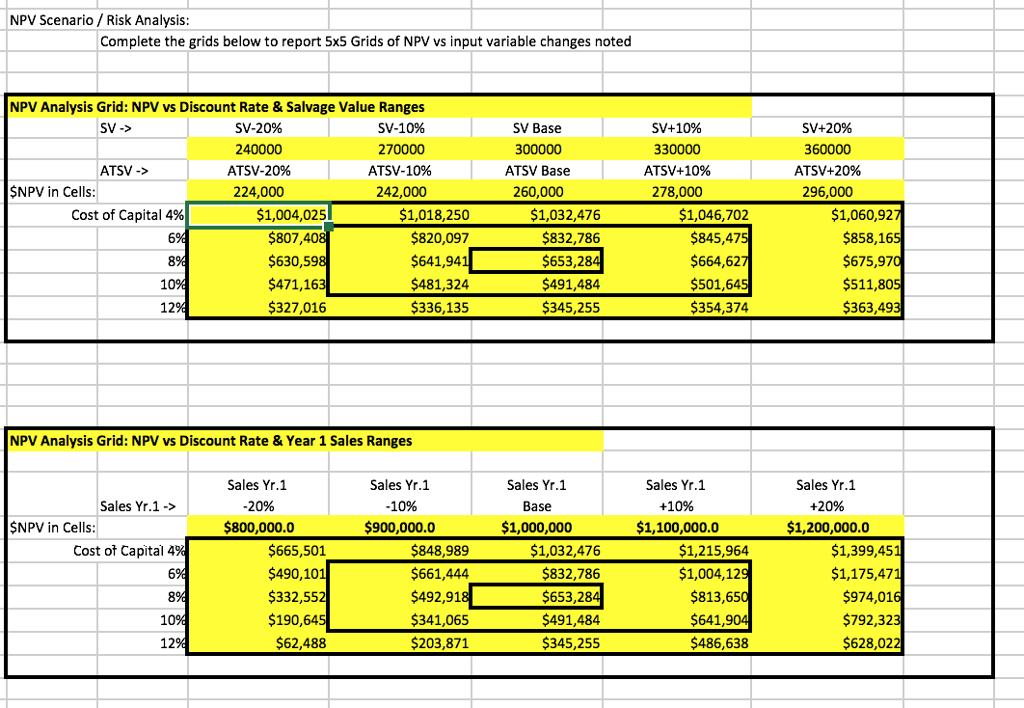
Based on your NPV Scenario / Risk Analysis Grids, is NPV more sensitive to changing cost of capital or changing salvage values? How do you determine this?
Based on your NPV Scenario / Risk Analysis Grids, is NPV more sensitive to changing cost of capital or changing year one sales level assumptions? How do you determine this?
NPV Scenario/ Risk Analysis: Complete the grids below to report 5x5 Grids of NPV vs input variable changes noted NPV Analysis Grid: NPV vs Discount Rate & Salvage Value Ranges 240000 ATSV-2096 224,000 SV-1096 270000 ATSV-10% 242,000 SV Base 300000 ATSV Base 260,000 SVt 1096 330000 ATSV+ 10% 278,000 SV+20% 360000 ATSV+20% 296,000 ATSV-> NPV in Cells: 1,004,025 $807,40 $630,59 $471,16 327,016 $1,018,250 $820,097 $641,94 $481,324 $336,135 $1,032,476 832,786 $653,28 $491,484 345,255 $1,046,702 $845,47 $664,62 $501,64 354,374 $1,060,92 $858,16 $675,97 $511,80 $363,49 Cost of Capital 4% 6 10 12 NPV Analysis Grid: NPV vs Discount Rate & Year 1 Sales Ranges Sales Yr.1 20% $800,000.0 Sales Yr.1 -10% $900,000.0 Sales Yr.1 Base $1,000,000 Sales Yr.1 +10% $1,100,000.0 Sales Yr.1 +20% $1,200,000.0 Sales Yr.1-> NPV in Cells $665,501 $490,10 $332,55 $190,64 $848,989 $661,444 $492,91 $341,065 $203,871 $1,032,476 $832,786 $653,28 $491,484 $345,255 $1,215,964 $1,004,12 $813,65 $1,399,45 $1,175,47 $974,01 $792,32 $628,02 Cost ot Capital 4 10 $641 12 $62,488 $486,638
Step by Step Solution
There are 3 Steps involved in it

Get step-by-step solutions from verified subject matter experts