

Question: Based upon the given financial statements for Pepsi, answer the following questions concerning the creation of the DuPont Ratio Analysis. Use the supplied Dupont Excel
| Based upon the given financial statements for Pepsi, answer the following | |||
| questions concerning the creation of the DuPont Ratio Analysis. | |||
| Use the supplied Dupont Excel Template in the same file. |
What is the Total Asset Turnover Rate in 2018?
| a. | Total Asset Turnover for Pepsi in 2018 = 0.8327 | |
| b. | Total Asset Turnover for Pepsi in 2018 = 0.5372 | |
| c. | Total Asset Turnover for Pepsi in 2018 = 0.6327 | |
| d. | Total Asset Turnover for Pepsi in 2018 = 0.7238 |
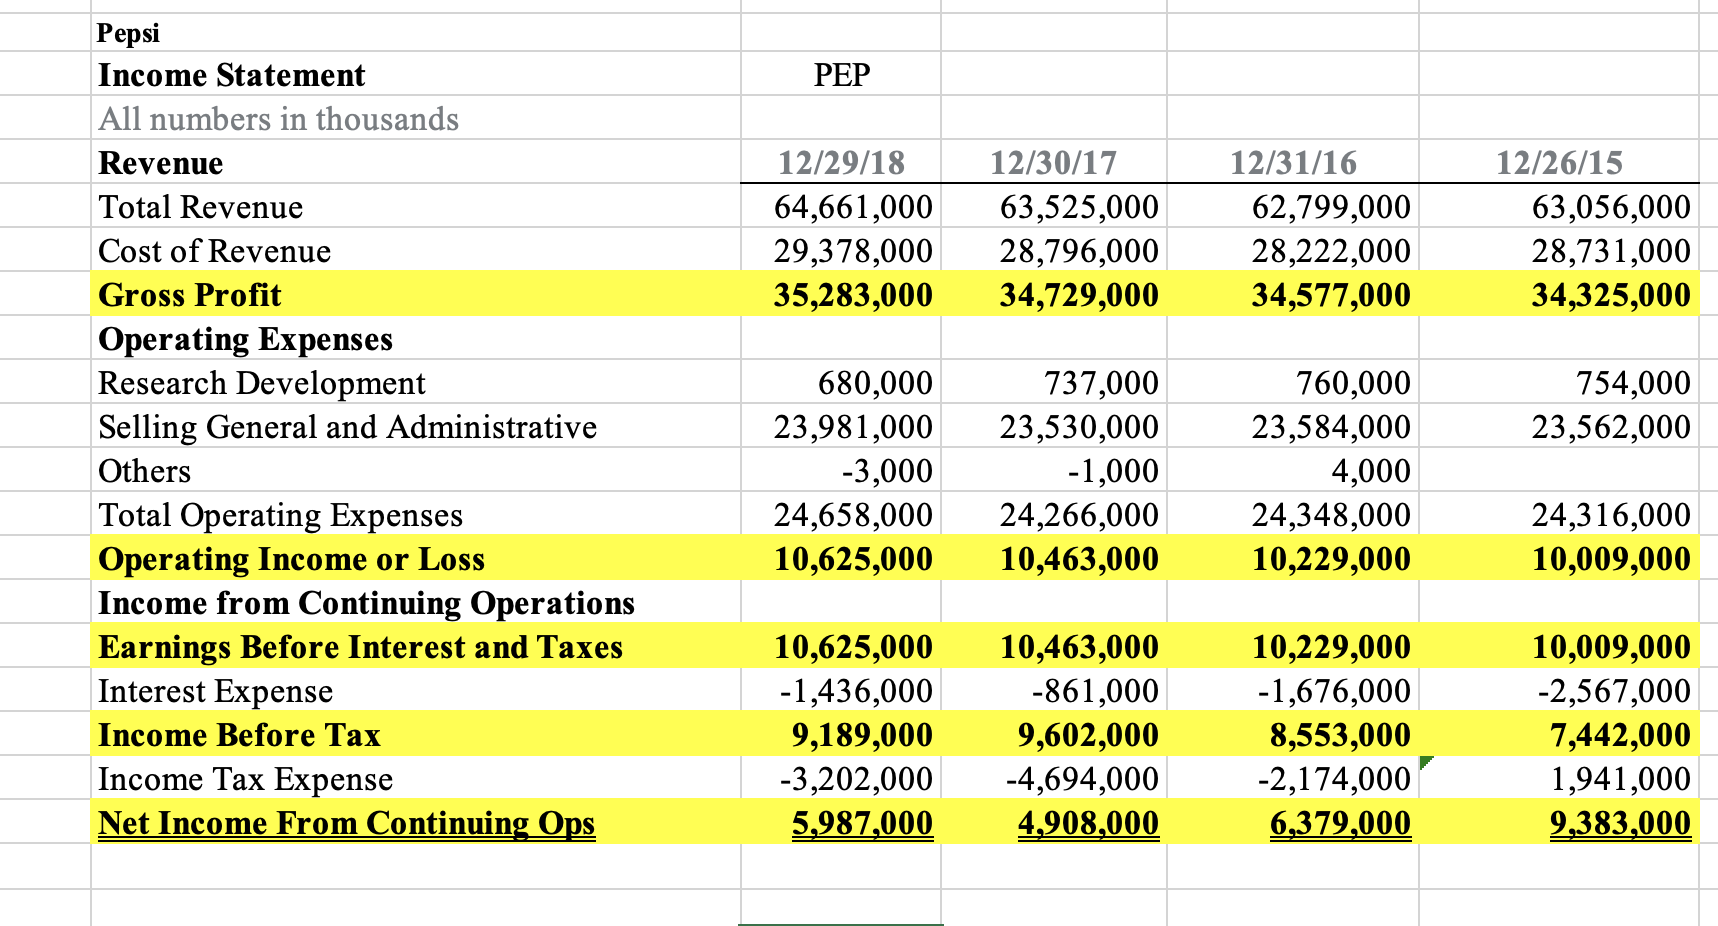
PEP 12/29/18 64,661,000 29,378,000 35,283,000 12/30/17 63,525,000 28,796,000 34,729,000 12/31/16 62,799,000 28,222,000 34,577,000 12/26/15 63,056,000 28,731,000 34,325,000 Pepsi Income Statement All numbers in thousands Revenue Total Revenue Cost of Revenue Gross Profit Operating Expenses Research Development Selling General and Administrative Others Total Operating Expenses Operating Income or Loss Income from Continuing Operations Earnings Before Interest and Taxes Interest Expense Income Before Tax Income Tax Expense Net Income From Continuing Ops 754,000 23,562,000 680,000 23,981,000 -3,000 24,658,000 10,625,000 737,000 23,530,000 -1,000 24,266,000 10,463,000 760,000 23,584,000 4,000 24,348,000 10,229,000 24,316,000 10,009,000 10,625,000 -1,436,000 9,189,000 -3,202,000 5,987,000 10,463,000 -861,000 9,602,000 -4,694,000 4,908,000 10,229,000 -1,676,000 8,553,000 -2,174,000 6,379,000 10,009,000 -2,567,000 7,442,000 1,941,000 9,383,000
Step by Step Solution
There are 3 Steps involved in it

Get step-by-step solutions from verified subject matter experts