

Question: Based upon the Mg-Ag phase diagram in the figure below plot the composition vs. distance profile that would develop upon annealing a Mg/Ag diffusion couple
Based upon the Mg-Ag phase diagram in the figure below plot the composition vs. distance profile that would develop upon annealing a Mg/Ag diffusion couple at 400 C before complete equilibrium is reached. For an overall composition of Mg-30wt% Ag draw the final position of the diffusion front in a couple of length, L
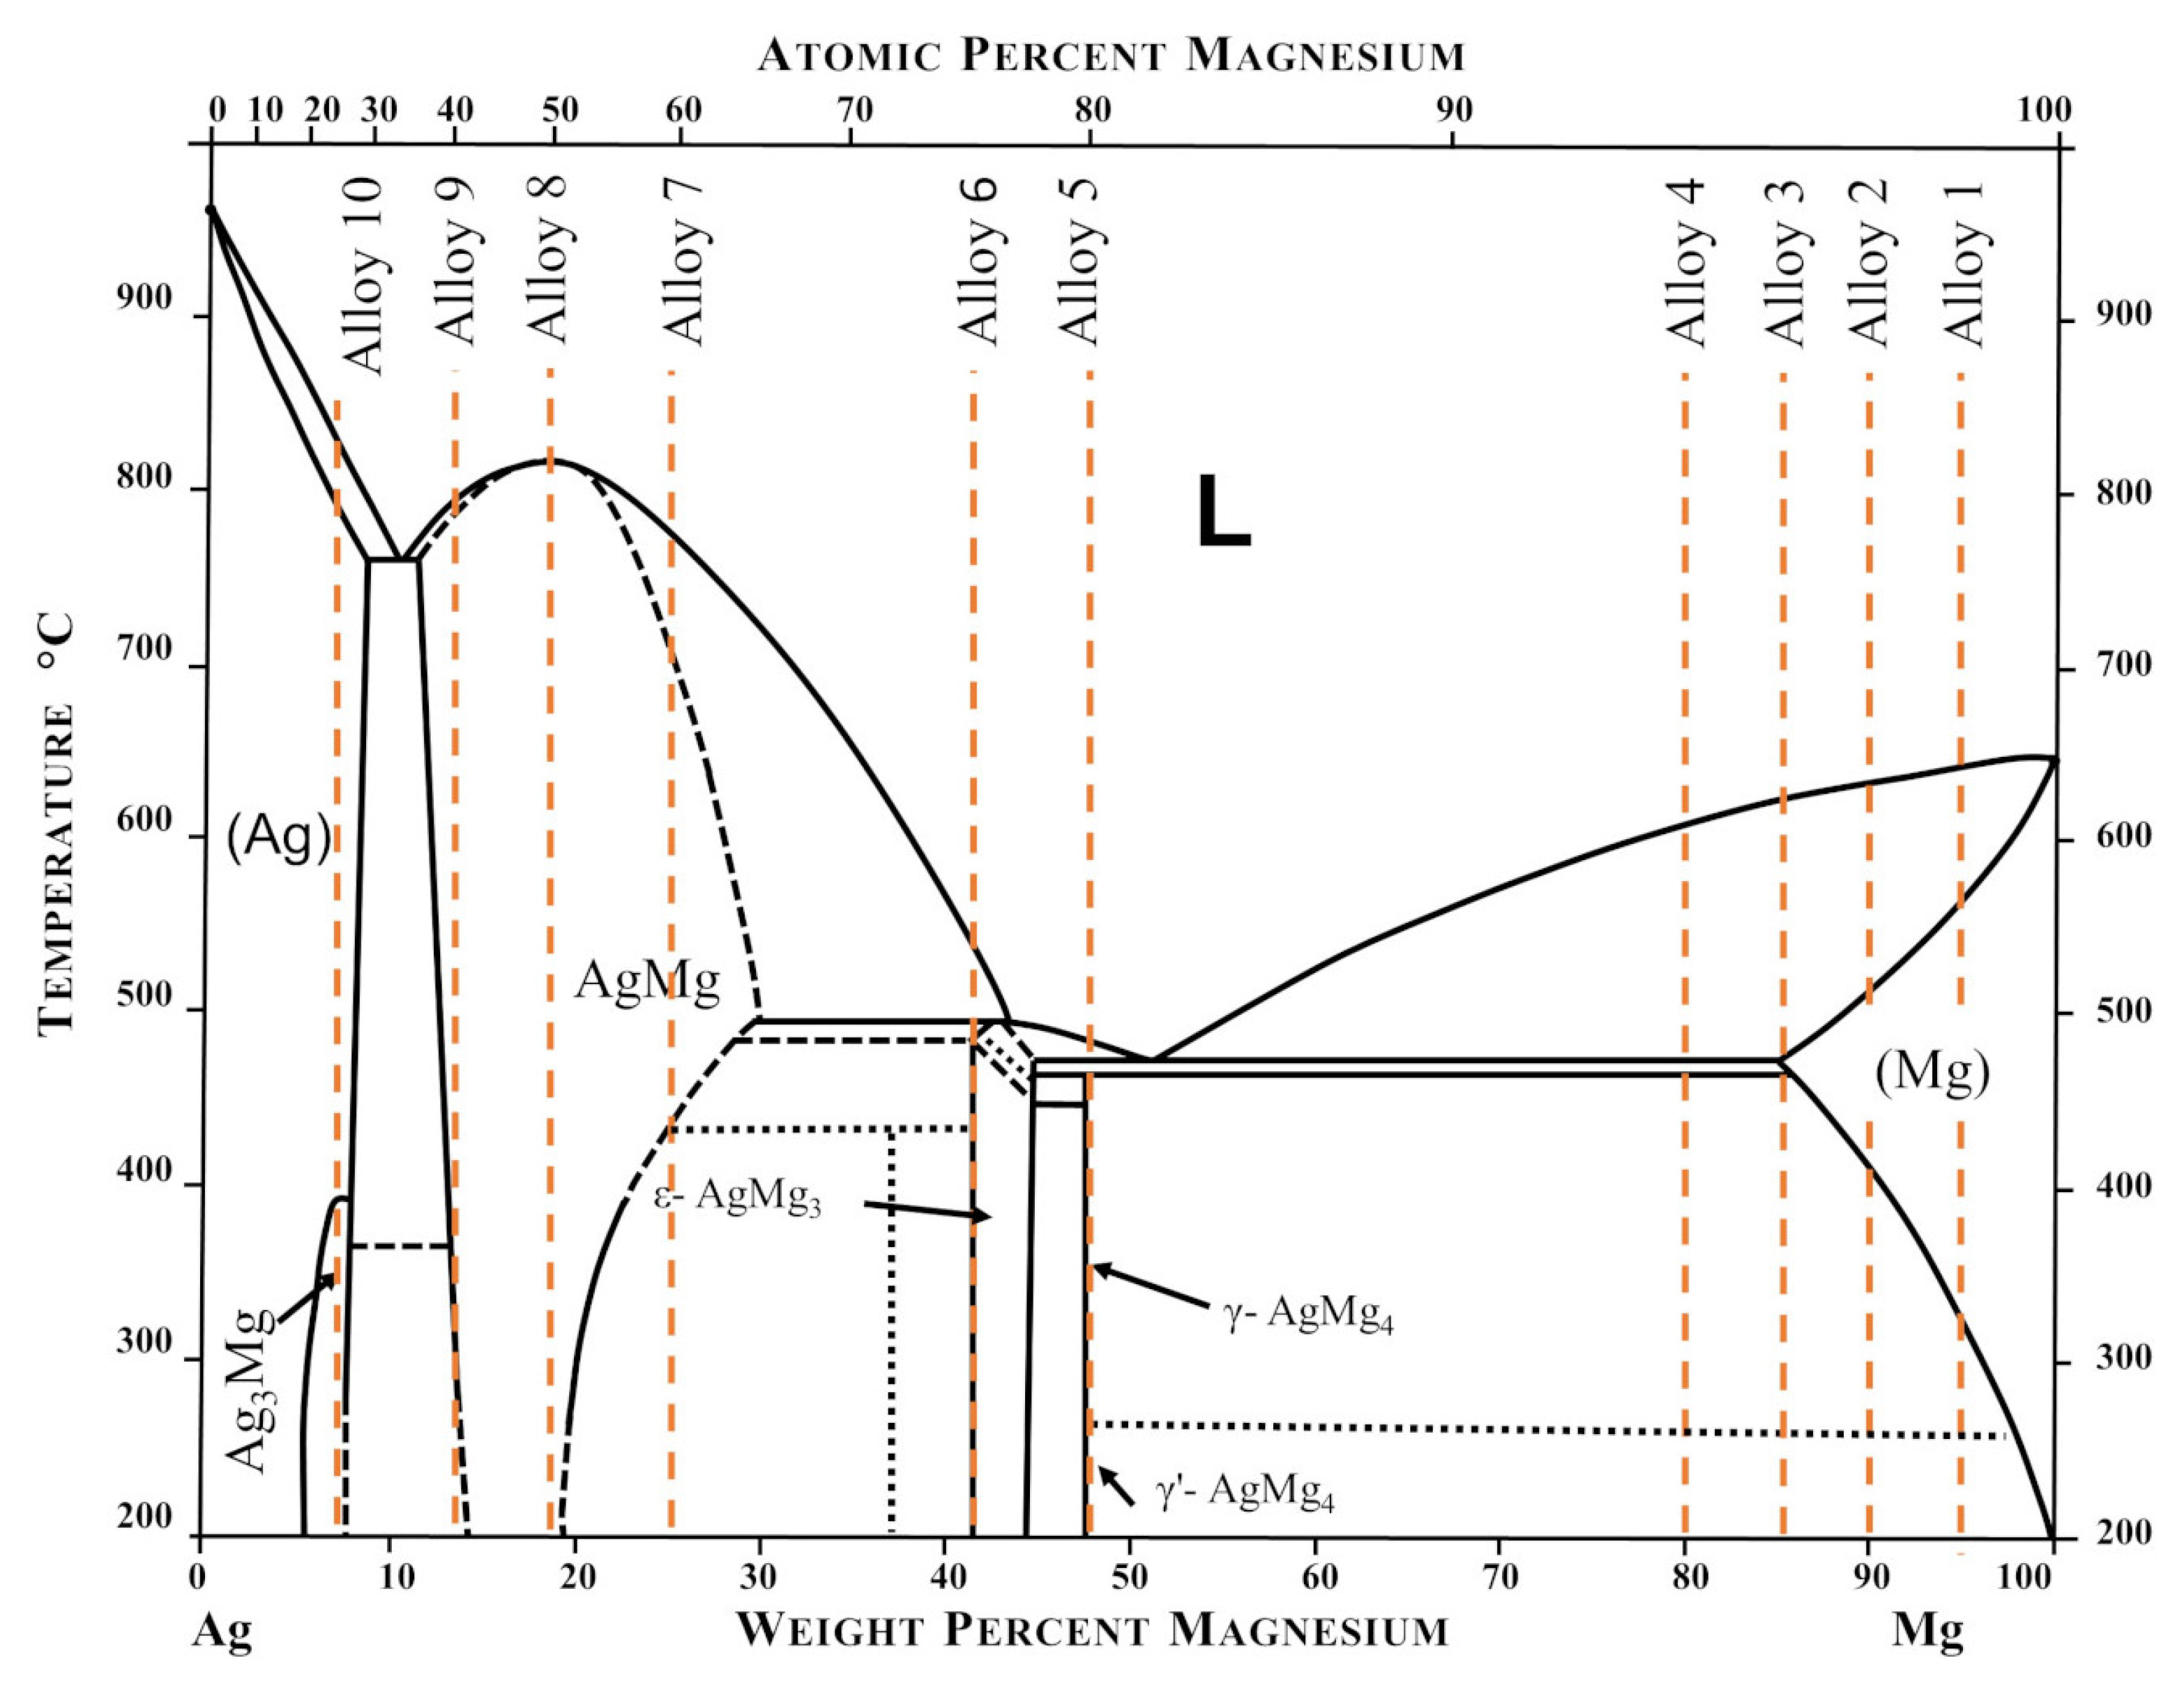
Atomic Percent Magnesium
Step by Step Solution
There are 3 Steps involved in it
1 Expert Approved Answer
Step: 1 Unlock

Question Has Been Solved by an Expert!
Get step-by-step solutions from verified subject matter experts
Step: 2 Unlock
Step: 3 Unlock