

Question: Batelco Inc. is considering two mutually exclusive projects A and B. Each project requires an initial investment as presented in the below table. The life
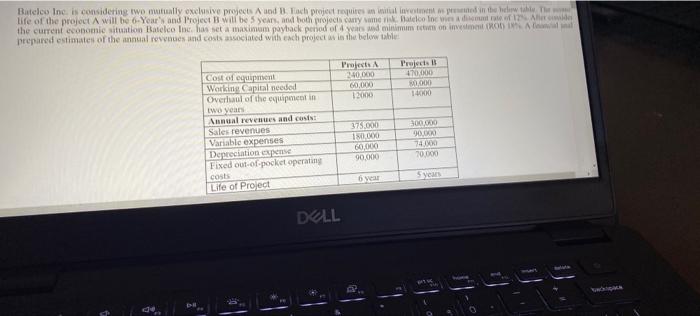
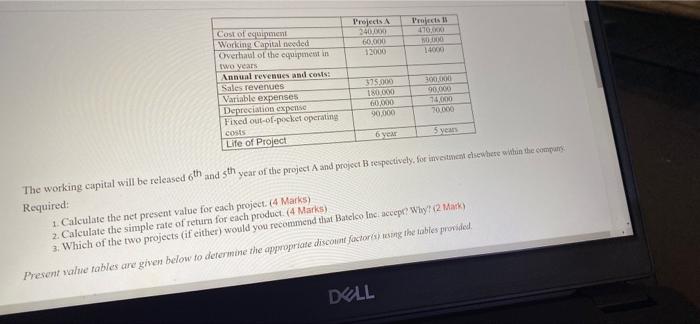
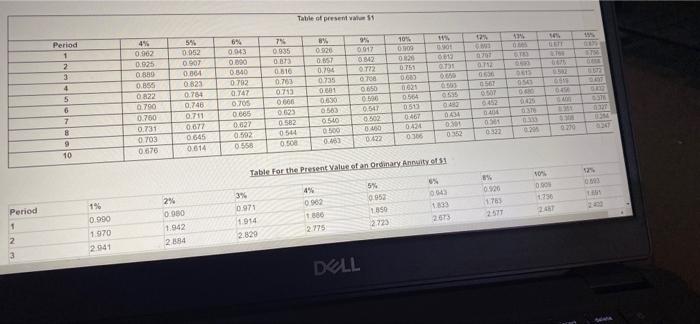
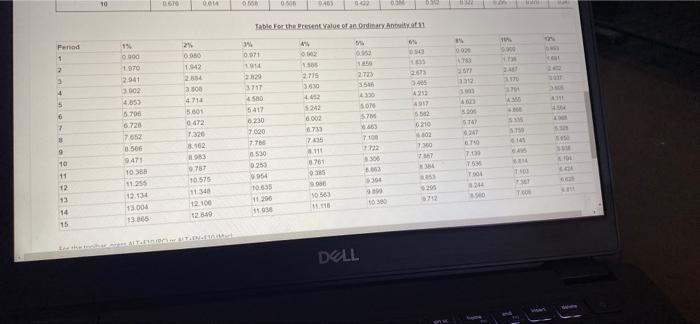
Batelco Inc. is considering two mutually exclusive projects A and B. Each project requires an initial investment as presented in the below table. The life of the project A will be 6-Year's and Project B will be 5 years, and both projects carry same risk. Batelco loc wies a disement rate of 12% Allerede the current economic situation Batelco Inc. has set a maximum payback period of 4 years and minimum return on investment (ROD) 18% A financial anal prepared estimates of the annual revenues and costs associated with each project as in the below table Projects A 240,000 Projects B 470,000 Cost of equipment Working Capital needed Overhaul of the equipment in t 60,000 80,000 12000 14000 two years Annual revenues and costs: Sales revenues 375.000 300,000 Variable expenses 180.000 90,000 74.000 60.000 Depreciation expense 70,000 90,000 Fixed out-of-pocket operating costs Life of Project 6 year 5 years backspike DE DELL Projects A 240,000 470,000 Cost of equipment Working Capital needed Overhaul of the equipment in 60,000 50,000 12000 14000 two years Annual revenues and costs: Sales revenues 375,000 300,000 Variable expenses 180,000 90,000 Depreciation expense 60,000 74,000 70,000 90,000 Fixed out-of-pocket operating costs 5 years 6 year Life of Project year of the project A and project B respectively, for investment elsewhere within the company The working capital will be released 6th and sth. Required: 1. Calculate the net present value for each project. (4 Marks) 2. Calculate the simple rate of return for each product. (4 Marks) 3. Which of the two projects (if either) would you recommend that Batelco Inc. accept? Why? (2 Mark) Present value tables are given below to determine the appropriate discount factors) using the tables provided. DELL Period 1 2 Period 1 2 3 4 6678 9 10 1% 0.990 1970 2.941 4% 0.962 0.925 0.889 0.855 0.822 0.790 0.760 0.731 0.703 0.676 5% 0.952 0.907 0.864 0.823 0.764 0.746 0.711 0.677 0.645 0.614 2% 0 980 1942 2884 Table of present value $1 6% 7% 9% 10% 0.943 0.935 8% 0.926 0.917 6.909 0.000 0.873 0.857 0842 0.829 0.840 0.816 0.794 0772 0.751 0.792 0.763 0.735 0708 0.083 0.747 0.713 0.001 0.650 0021 0,705 0.666 0.630 0506 0.564 0.665 0563 0.623 0.647 0482 0513 0.582 0.627 0540 0.502 0434 0467 0544 0.502 0500 0.460 0301 0424 0.463 0.508 0558 0.352 0306 0.422 Table For the Present Value of an Ordinary Annuity of $1 6% 5% 4% 3% 10643 0.952 0.971 0.962 1.850 1.914 1.886 2.673 2.723 2.775 2.829 DELL 14% 0.901 0812 0.791 0.650 0503 9550 12% LIS 0707 0712 6.536 0567 0.507 6452 0404 0501 0332 8% 0.920 1.785 2577 43% 0783 0803 0613 0543 GAND 0435 6376 0.333 0.295 10% 14% LENT 0675 0819 045 8000 1736 2487 438 0620 15% 659 8756 1872 DAST 6327 WEDE 125 0503 1.AM 2400 Ferod 1 2 3 4 5 6 B 9 10 11 12 13 14 15 1% o 990 1.970 2.941 3902 4.853 5.706 6.728 7.652 8.566 9471 10.388 11.255 12.134 13.004 13.865 11670 2% 0.000 1942 2.884 13.000 0.014 4714 15.601 0472 7.326 8.102. 1983 9767 10.575 11.348 12.100 12.849 4900 0506 0405 0422 0.3M 0302 Table For the Present value of an Ordinary Annuity.af.31 3% 4% 0% 0.971 0543 1914 1835 2829 2673 3717 405 4580 4212 5417 4917 6,230 6502 7,020 6210 802 7.766 7.300 0530 7367 0253 384 954 10.635 $295 11.200 11.938 2010 1.506 2775 3.630 4.452 5242 6.002 6.733 7.435 8111 8.761 0.385 9.906 10563 11.118 DELL M 0.052 1850 2723 3546 4330 5076 57M 6463 7.100 13.722 $300 4.003 $304 9800 10:380 11342 *% 0920 4763 677 3312 3001 AX23 8.201 5747 6247 6710 7.199 763 1904 244 540 curs 10% 5300 1.79 2487 3370 3701 www.w 4300 SAM 5.750 TURK 6141 CAV 3314 1500 (2) 7806 25 www IMA 142 A311 4.504 5.329 A450 330 101 1.400 AGR Katt
Step by Step Solution
There are 3 Steps involved in it

Get step-by-step solutions from verified subject matter experts