

Question: Bayes minimum risk classifier 3. This problem uses the minimum risk criterion (instead of minimum error criterion) for classification (introduced in Lecture 21, covered in
Bayes minimum risk classifier
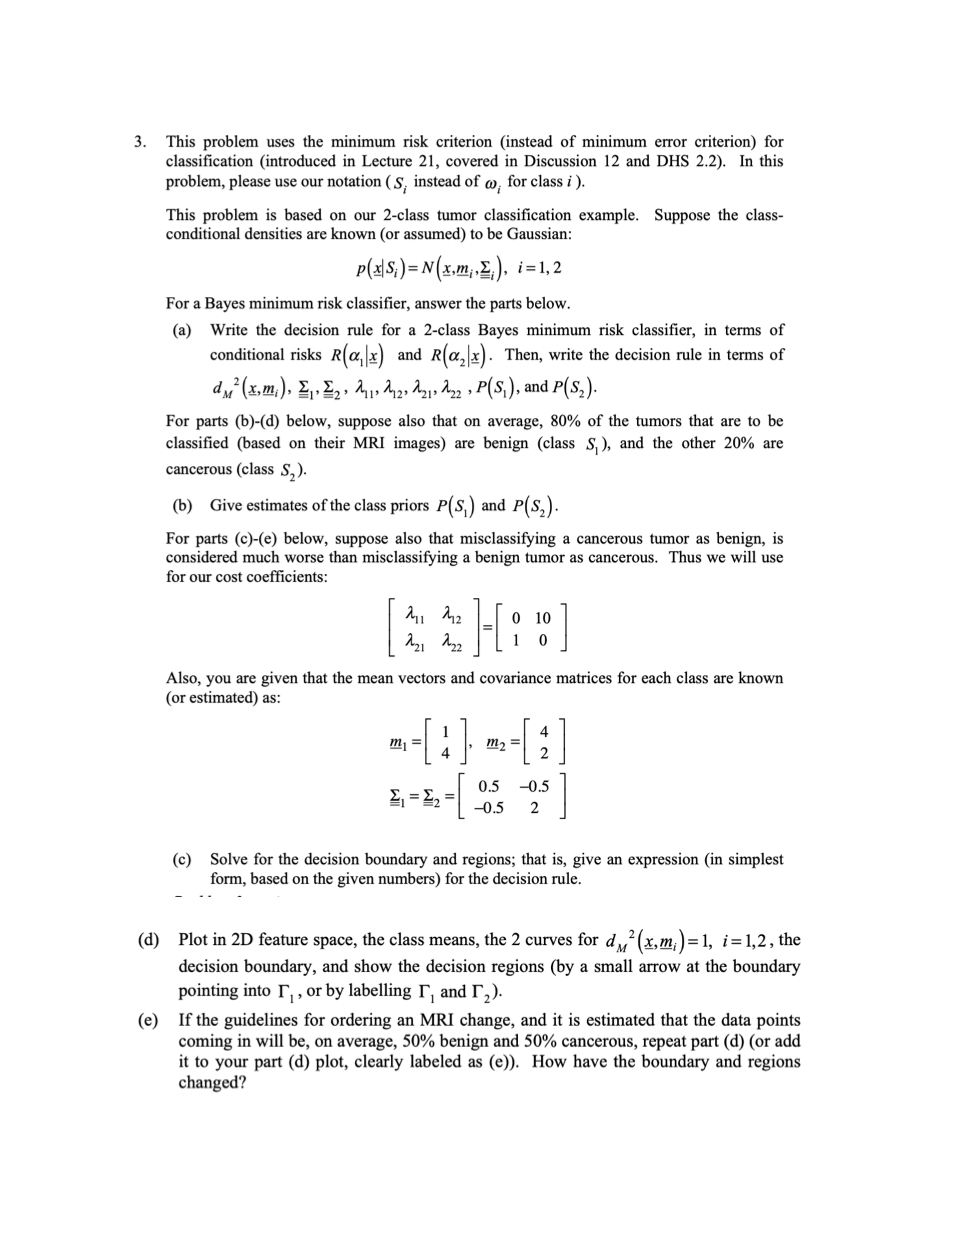
3. This problem uses the minimum risk criterion (instead of minimum error criterion) for classification (introduced in Lecture 21, covered in Discussion 12 and DHS 2.2). In this problem, please use our notation ( S; instead of @); for class i ). This problem is based on our 2-class tumor classification example. Suppose the class- conditional densities are known (or assumed) to be Gaussian: p(x)s,)= N(x,m, , 2,), i=1,2 For a Bayes minimum risk classifier, answer the parts below. (a) Write the decision rule for a 2-class Bayes minimum risk classifier, in terms of conditional risks R(a, |x) and R(a,|x). Then, write the decision rule in terms of du? (x,m;), 21 2. I ,2. 121, 122 , P(S,), and P(S2). For parts (b)-(d) below, suppose also that on average, 80% of the tumors that are to be classified (based on their MRI images) are benign (class S, ), and the other 20% are cancerous (class S2). (b) Give estimates of the class priors P(S, ) and P(S2). For parts (c)-(e) below, suppose also that misclassifying a cancerous tumor as benign, is considered much worse than misclassifying a benign tumor as cancerous. Thus we will use for our cost coefficients: 121 2 2 2 Also, you are given that the mean vectors and covariance matrices for each class are known (or estimated) as: 21 = 22= 0.5 -0.5 2 (c) Solve for the decision boundary and regions; that is, give an expression (in simplest form, based on the given numbers) for the decision rule. (d) Plot in 2D feature space, the class means, the 2 curves for du (x, m;) =1, i=1,2, the decision boundary, and show the decision regions (by a small arrow at the boundary pointing into I , or by labelling I, and I2). (e) If the guidelines for ordering an MRI change, and it is estimated that the data points coming in will be, on average, 50% benign and 50% cancerous, repeat part (d) (or add it to your part (d) plot, clearly labeled as (e)). How have the boundary and regions changed
Step by Step Solution
There are 3 Steps involved in it

Get step-by-step solutions from verified subject matter experts