

Question: ............ Bb Course Information - 202108- X Bb Take Test: ICA 6 - 202108-STA X Local Folding@home Web Cont x + C ecampus.wvu.edu/webapps/assessment/take/launch.jsp?course_assessment_id=_335176_1&course_id=_171704_1&content_id=_8801255_1&step=null i Apps
............
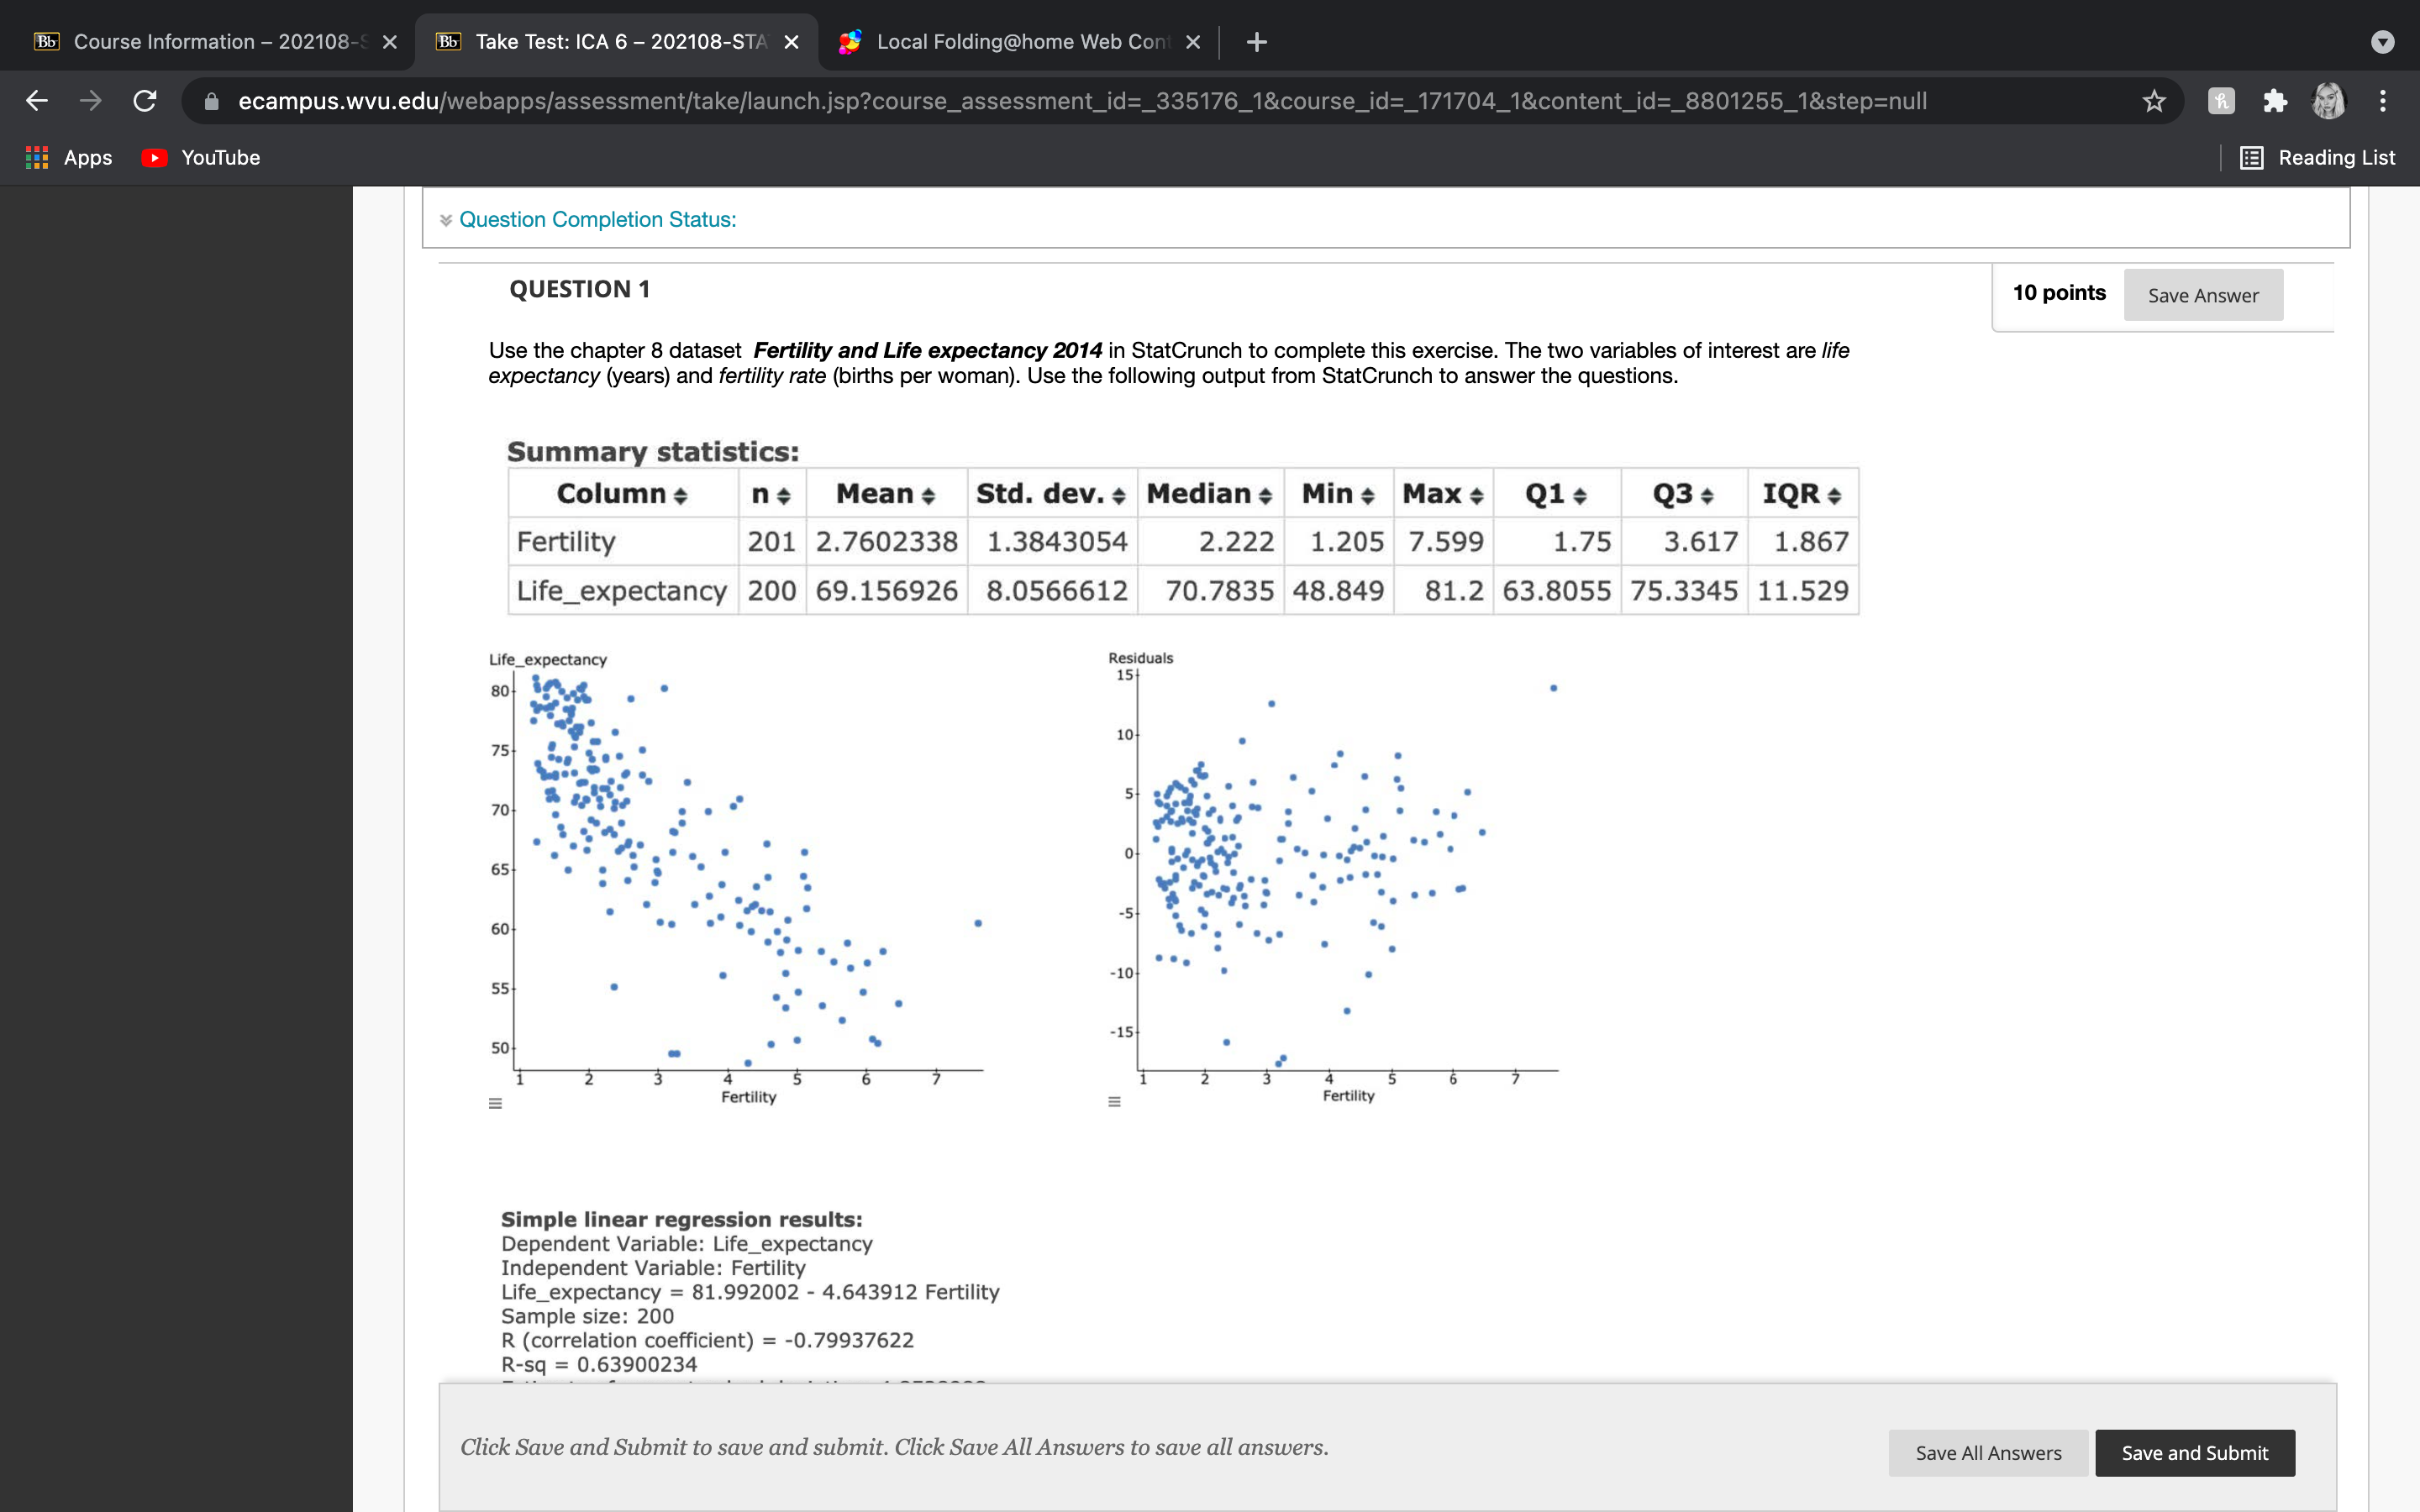
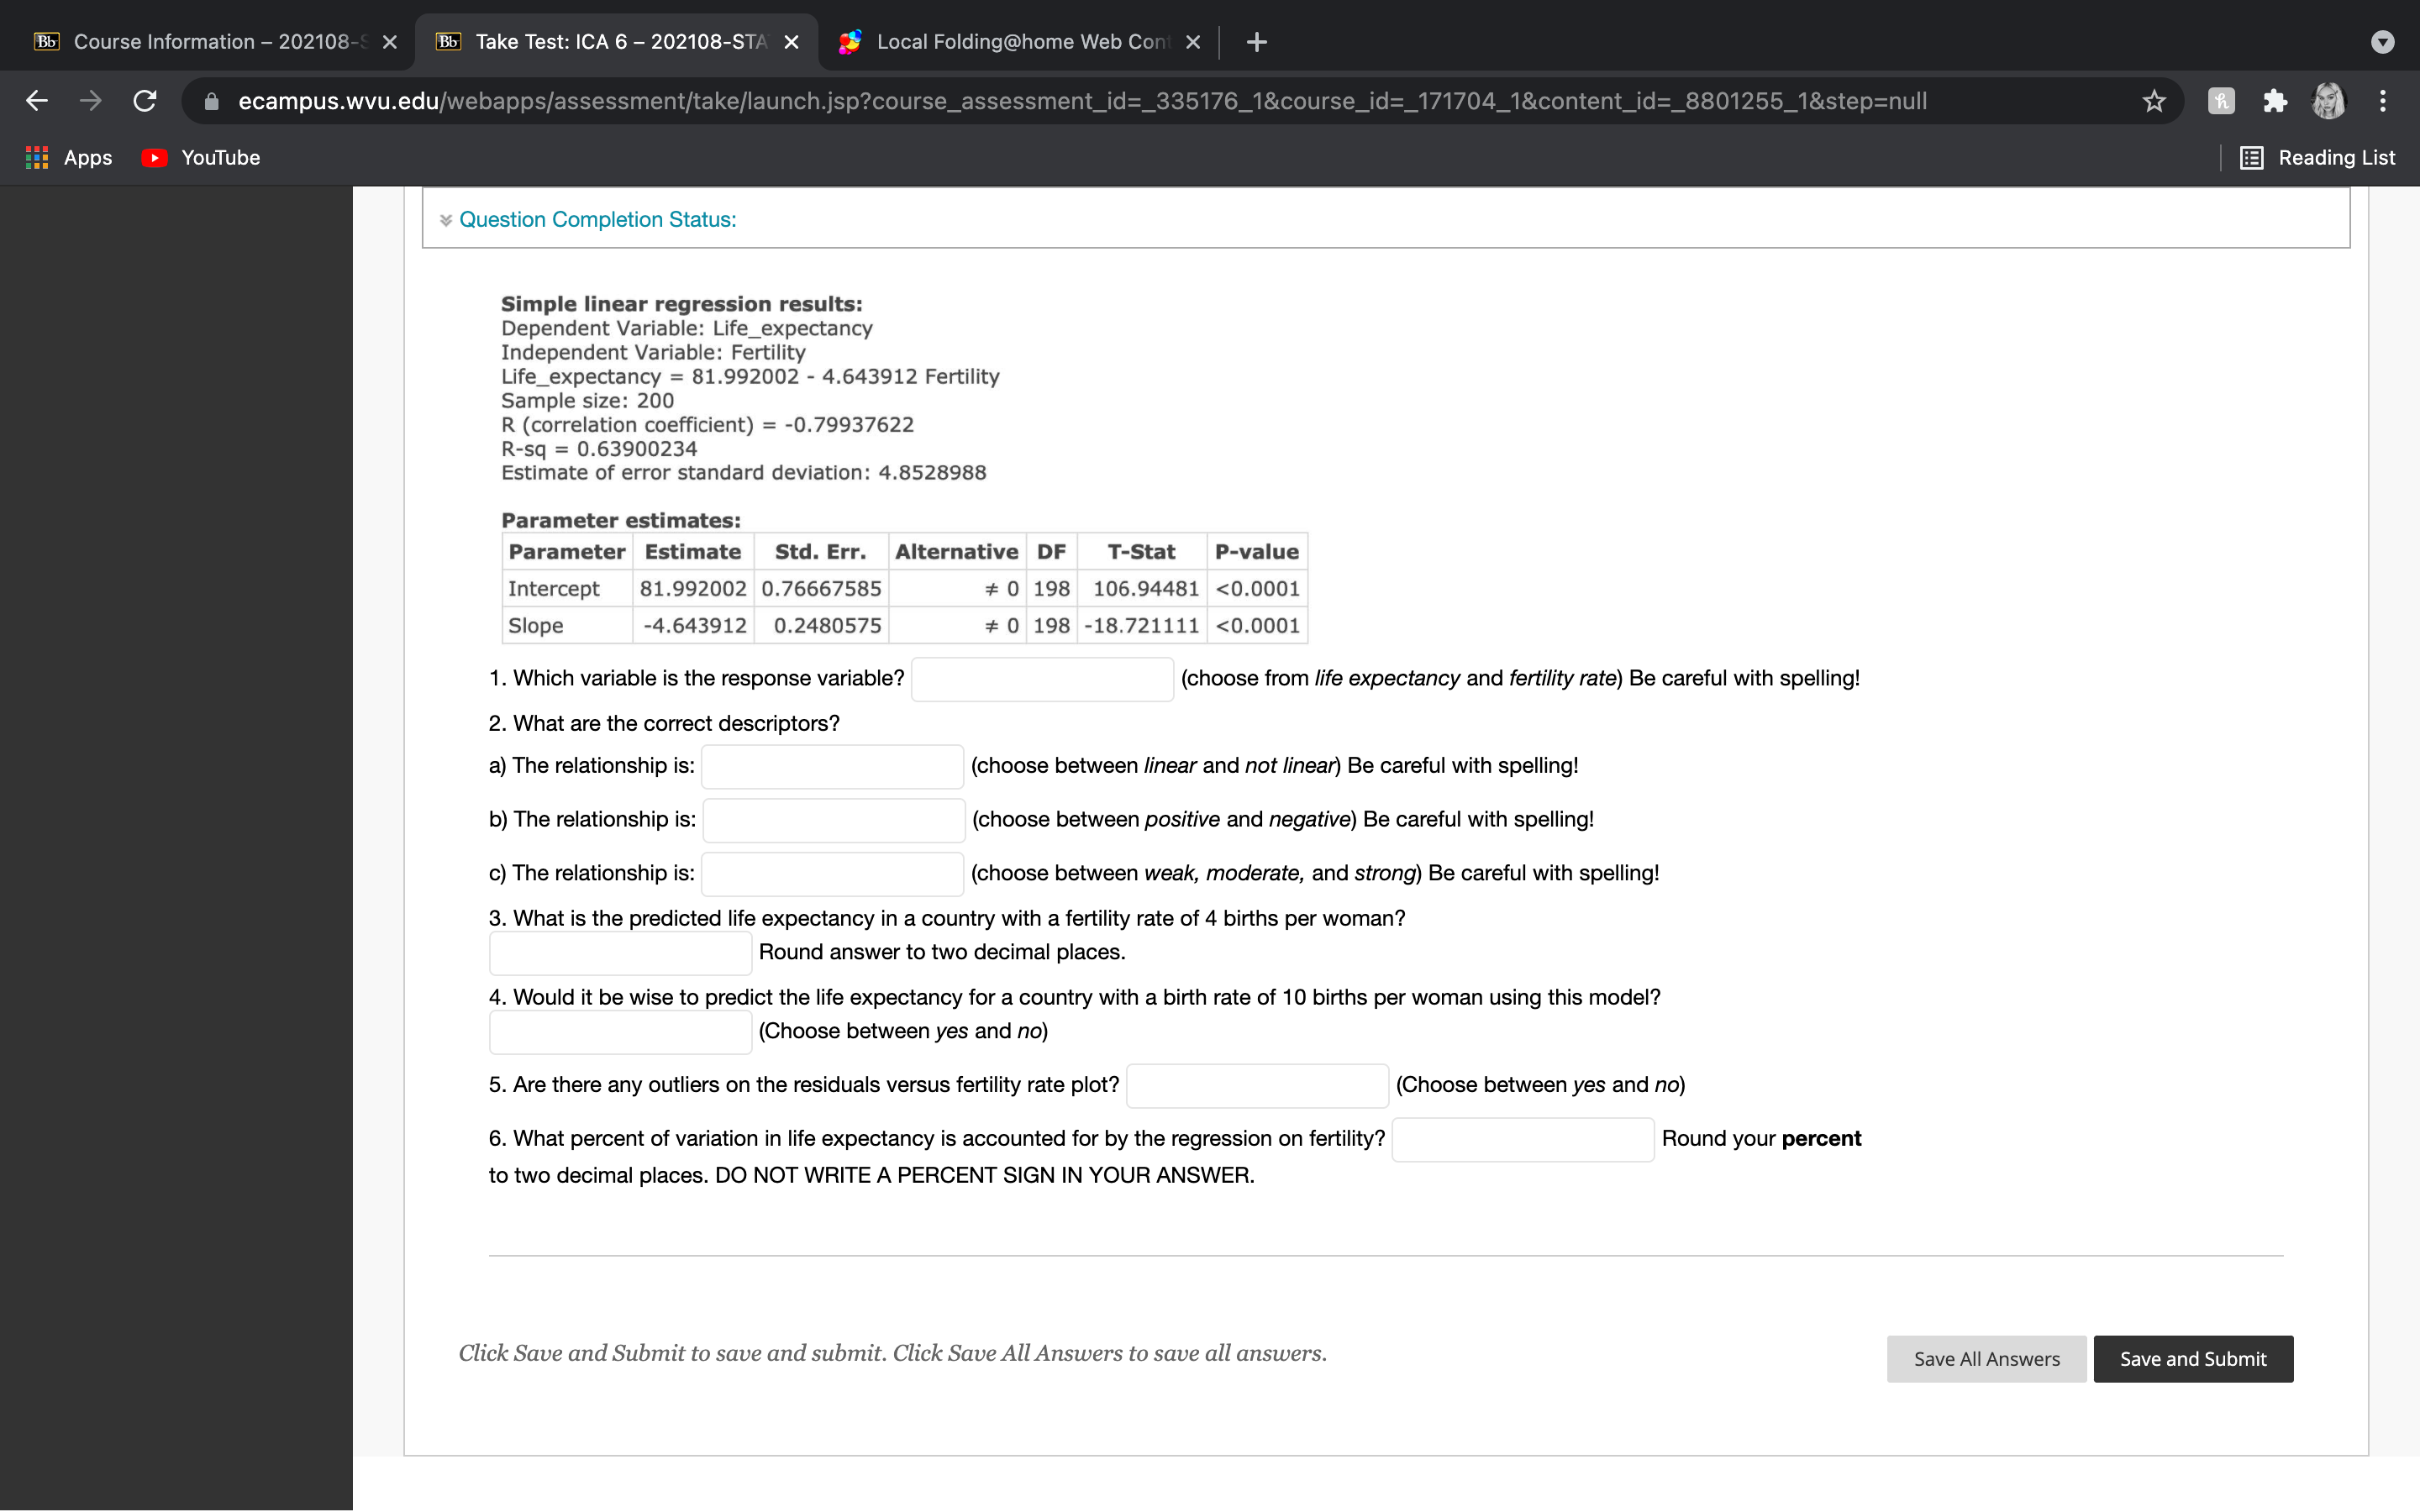
Bb Course Information - 202108- X Bb Take Test: ICA 6 - 202108-STA X Local Folding@home Web Cont x + C ecampus.wvu.edu/webapps/assessment/take/launch.jsp?course_assessment_id=_335176_1&course_id=_171704_1&content_id=_8801255_1&step=null i Apps YouTube Reading List Question Completion Status: QUESTION 1 10 points Save Answer Use the chapter 8 dataset Fertility and Life expectancy 2014 in StatCrunch to complete this exercise. The two variables of interest are life expectancy (years) and fertility rate (births per woman). Use the following output from StatCrunch to answer the questions. Summary statistics: Column + n+ Mean + Std. dev. + Median + Min + Max + Q1 + Q3+ IQR + Fertility 201 2.7602338 1.3843054 2.222 1.205 7.599 1.75 3.617 1.867 Life_expectancy 200 69.156926 8.0566612 70.7835 48.849 81.2 63.8055 75.3345 11.529 Life_expectancy Residuals 151 10 75- 70 65 5 60 -10 55 -15 501 6 Fertility = Fertility Simple linear regression results: Dependent Variable: Life_expectancy Independent Variable: Fertility Life_expectancy = 81.992002 - 4.643912 Fertility Sample size: 200 R (correlation coefficient) = -0.79937622 R-sq = 0.63900234 Click Save and Submit to save and submit. Click Save All Answers to save all answers. Save All Answers Save and SubmitI}? u lnlnnwliun a \\ '7 Take Test: ICA 6 202108-5' X f; LLH .yl nirlum" WW 6 C' ecampus.wvu.edu Apps > YouTube E] Reading List 3 Question Completion Status: Simple linear regression results: Dependent Variable: Life_expectancy Independent Variable: Fertility Life_expectancy = 81.992002 - 4.643912 Fertility Sample size: 200 R (correlation coefcient) = -0.79937622 R-sq = 063900234 Estlmate of error standard devlatlon: 4.8528988 Parameter estimates: Parameter Estlmate std. Err. Alternative DF T-Stat P-value Intercept 81992002 076667585 $ 0 198 10634481
Step by Step Solution
There are 3 Steps involved in it

Get step-by-step solutions from verified subject matter experts