

Question: be preparing a consolidated sales forcast analysis and graph to show your results for CPU Computer Sales. Ltd. Firstly, Sales summary projections by product and
be preparing a consolidated sales forcast analysis and graph to show your results for CPU Computer Sales. Ltd. Firstly,
Sales summary projections by product and quarter for the cities of Toronto, Vancouver, Montreal. The data has been provided. Place your results in the "Sales Results Worksheet" Graph results by Yearly Totals and City. Pay attention to your linkages and results.Please provide the excel formula used
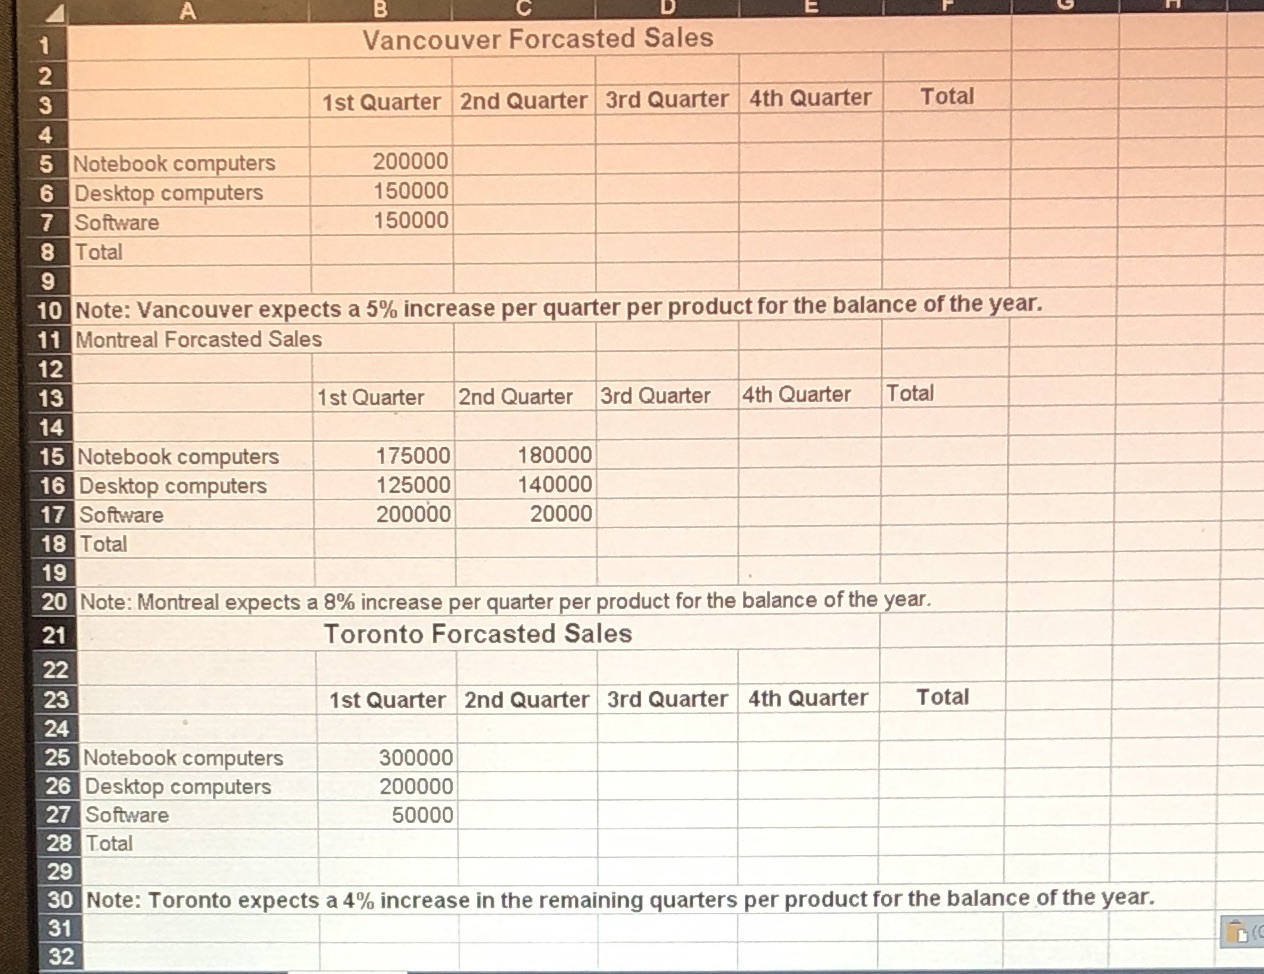
B C Vancouver Forcasted Sales 1st Quarter 2nd Quarter |3rd Quarter |4th Quarter Total 5 Notebook computers 200000 6 Desktop computers 150000 7 Software 150000 8 Total 9 10 Note: Vancouver expects a 5% increase per quarter per product for the balance of the year. 11 Montreal Forcasted Sales 12 13 1 st Quarter 2nd Quarter 3rd Quarter 4th Quarter Total 14 15 Notebook computers 175000 180000 16 Desktop computers 125000 140000 17 Software 200000 20000 18 Total 19 20 Note: Montreal expects a 8% increase per quarter per product for the balance of the year. 21 Toronto Forcasted Sales 22 23 1st Quarter 2nd Quarter 3rd Quarter |4th Quarter Total 24 25 Notebook computers 300000 26 Desktop computers 200000 27 Software 50000 28 Total 29 30 Note: Toronto expects a 4% increase in the remaining quarters per product for the balance of the year. 31 32
Step by Step Solution
There are 3 Steps involved in it

Get step-by-step solutions from verified subject matter experts