

Question: (Be sure to attach all graphs.) Part A: Data Table 1: Trial Trial Trial Trial Trial Height Average 2 3 4 5 Time 25cm 295
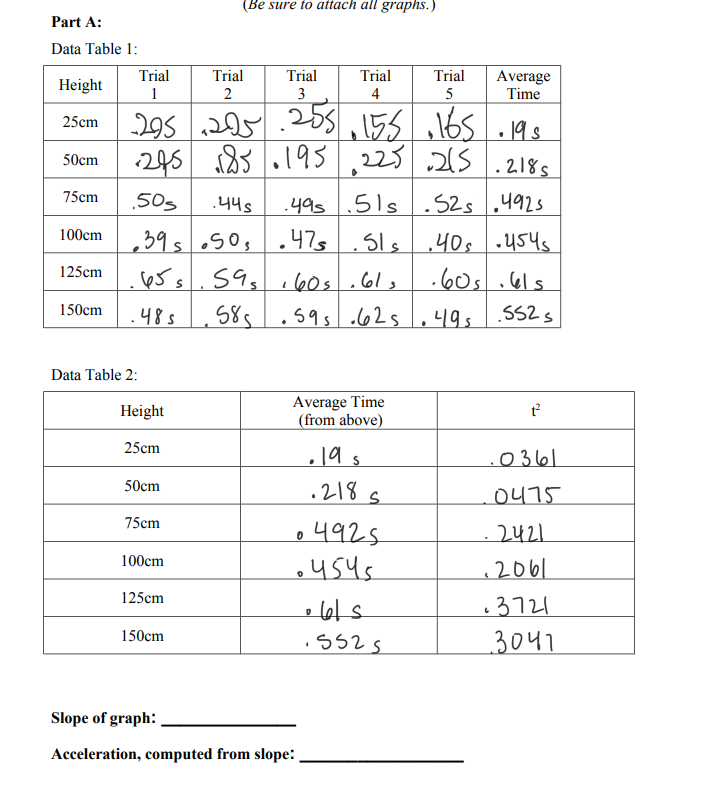
(Be sure to attach all graphs.) Part A: Data Table 1: Trial Trial Trial Trial Trial Height Average 2 3 4 5 Time 25cm 295 , 205 255 155 ,165 . 19 s 50cm 295 185 . 195 225 . 2185 75cm 50s . 44s . 49s .51s . 52s . 492s 100cm 39 s .50 , . 47s . SIs 1. 454s 125cm 45s. 595 1405 . 61, . 60s . 41 5 150cm . 48 s 585 . 59s . 625 . 49 s 1.552 s Data Table 2: Average Time Height 12 ( from above) 25cm . 19 s 0 361 50cm . 218 5 0475 75cm . 4925 2421 100cm . 4545 2061 125cm . lol s . 3721 150cm . 5525 3047 Slope of graph: Acceleration, computed from slope
Step by Step Solution
There are 3 Steps involved in it
1 Expert Approved Answer
Step: 1 Unlock

Question Has Been Solved by an Expert!
Get step-by-step solutions from verified subject matter experts
Step: 2 Unlock
Step: 3 Unlock