

Question: Be sure to use a Shifted Time Line for each gradient. The Cash Flow Diagram given in the problem contains: 1. An Increasing Arithmetic Gradient
Be sure to use a Shifted Time Line for each gradient.
The Cash Flow Diagram given in the problem contains:
1. An Increasing Arithmetic Gradient of Negative Cash Flows in years 24.
2. A Decreasing Arithmetic Gradient of Negative and Positive Cash Flows in years 6-10.
Work with each gradient separately using the appropriate shifted time lines to compute their respective Future Worth in year 10.
Then ADD the two Future Worth Values together to get the total Future Worth amount.
Do not use single payment analysis when you have gradients and annuities.
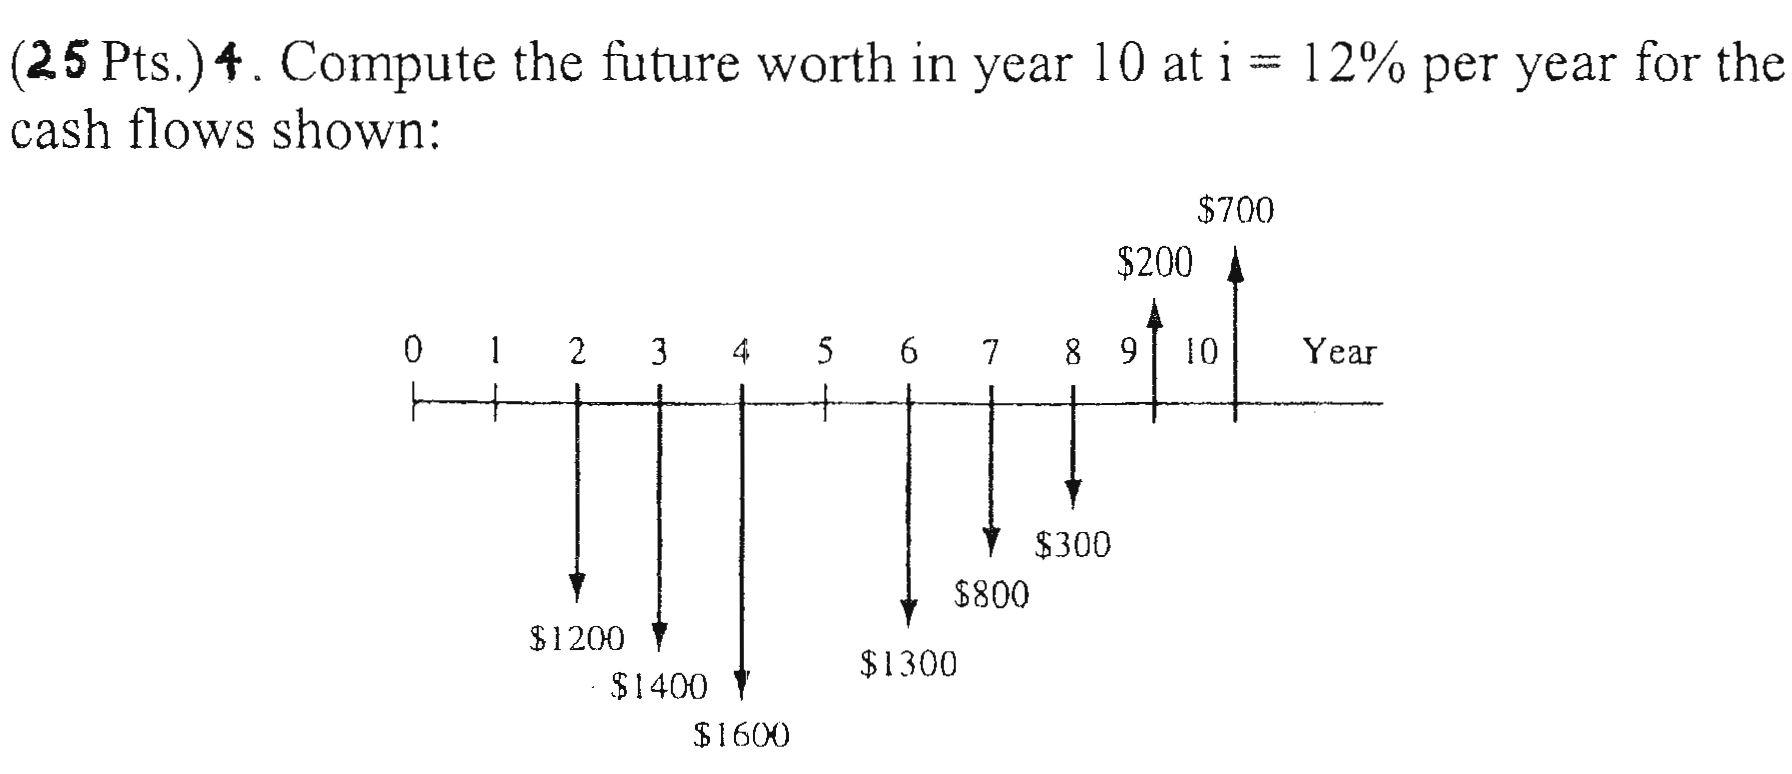
(25 Pts.) 4. Compute the future worth in year 10 at i = 12% per year for the cash flows shown: $700 $200 0 1 2 3 6 7 8 9 10 Year 4 5 + $300 $800 $1300 $1200 $1400 $1600 (25 Pts.) 4. Compute the future worth in year 10 at i = 12% per year for the cash flows shown: $700 $200 0 1 2 3 6 7 8 9 10 Year 4 5 + $300 $800 $1300 $1200 $1400 $1600
Step by Step Solution
There are 3 Steps involved in it

Get step-by-step solutions from verified subject matter experts