

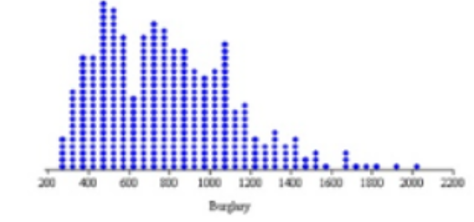
Question: Because most data values are on the left, we would say that this dot plot (burglary rates per 100,000 persons in 350 US cities) shows
Because most data values are on the left, we would say that this dot plot (burglary rates per 100,000 persons in 350 US cities) shows a distribution that is skewed to the left (negatively skewed)
True or False.
400 600 900 1000 1200 1400 1600 1800 2000 Bapuary
Step by Step Solution
★★★★★
3.34 Rating (145 Votes )
There are 3 Steps involved in it
1 Expert Approved Answer
Step: 1 Unlock

False The distribution in the dot plot shows th... View full answer
Question Has Been Solved by an Expert!
Get step-by-step solutions from verified subject matter experts
Step: 2 Unlock
Step: 3 Unlock